The Stock That Went From $24,480,000,000 a Share to $7 a Share

by Fred Fuld III

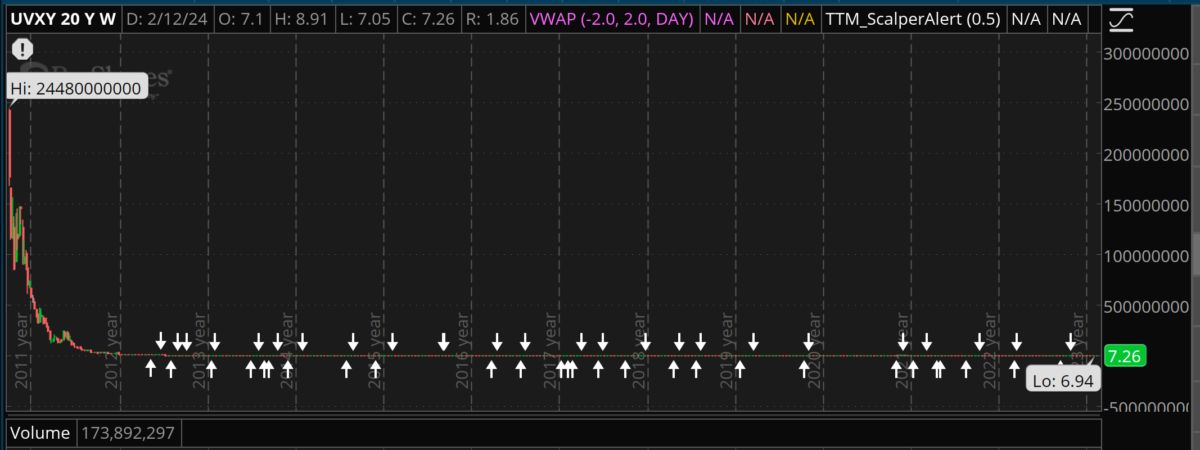
Yes, you read that right. There was a stock that traded at $24,480,000,000 per share on a split adjusted basis back on October 3, 2011. That’s $24.48 billion!!!

Today, the stock is trading at $7.25 per share.

The company has had numerous reverse splits, which account for its very high historical price.

Not too bad a trade if you were short it.

Actually it is technically an exchange traded fund, more commonly called an ETF.

This ETF is the ProShares Ultra VIX Short-Term Futures ETF (UVXY), has a goal of producing one and one-half times (1.5x) the daily performance of the S&P 500 VIX Short-Term Futures Index.

The problem with investing in these kinds of ETFs are the risks that are involved, which can affect the price adversely if held for long periods of time. These risks include:

High Volatility: UVXY aims to deliver 1.5 times the daily performance of the S&P 500 VIX Short-Term Futures Index, which tracks the implied volatility of the S&P 500. Volatility is inherently unpredictable, and even small movements in the VIX can lead to large swings in UVXY’s price. This means you could lose a significant portion of your investment very quickly.

Leverage: UVXY uses leverage to achieve its 1.5x target. This means it uses borrowed money to amplify returns, which magnifies both gains and losses. While leverage can lead to larger profits in rising markets, it can also lead to much steeper losses in declining markets.

Decay over Time: Unlike traditional assets that tend to appreciate over time, VIX futures tend to revert to their long-term average. This means holding UVXY for extended periods, even in volatile markets, could lead to significant losses due to this “backwardation” effect.

Rolling Costs: VIX futures contracts expire monthly, and UVXY needs to continuously roll these contracts into new ones. This rolling process incurs costs, which can eat into returns over time, especially during periods of low volatility.

Liquidity: While UVXY is an exchange-traded fund, its underlying futures contracts may have lower liquidity than stocks. This could make it difficult to enter or exit positions quickly, especially during volatile periods.

Expenses: UVXY has an expense ratio of 0.95%, which means it charges 0.95% of your assets annually for management fees. These fees can further erode your returns, especially over longer holding periods.

Not a Hedge: While some investors use UVXY as a hedge against market downturns, it’s crucial to understand that it’s not a perfect hedge. Its performance can be uncorrelated to market movements, and it may not effectively protect your portfolio during all market conditions.

These are extremely speculative ETFs which are appropriate for experienced traders only.

Thanks to Slope Of Hope for giving me the heads up about this.

Disclosure: Author’s no position in the above ETF.

NYSE Stocks with the Highest Short Interest

by Fred Fuld III

A short squeeze is a phenomenon that occurs in financial markets when investors who have sold shares of a stock short (i.e., betting that the stock price will fall) are forced to buy those shares back at a higher price than they expected. This can happen when the stock’s price rises sharply, causing losses for short sellers who need to buy the stock to cover their position and limit their losses.

As more and more short sellers try to buy the stock to close out their positions, this increased buying activity can drive the stock price even higher, creating a feedback loop that can lead to a rapid and dramatic increase in price. This can create a challenging situation for short sellers, who may be forced to buy back the stock at a loss, or risk even greater losses if the stock continues to rise. A short squeeze can also create opportunities for long investors who have purchased the stock, as they may be able to sell their shares at a higher price to short sellers looking to cover their positions.

On August 22, 2022, I posted an article about meme related short squeeze stocks, and pointed out Bed Bath and Beyond (BBBY) after it had its big run-up. In exactly one week after the article was posted, the stock jumped by more than 43%.

Another stock that was mentioned was Intercept Pharmaceuticals, Inc. (ICPT), which increased by almost 5% in just two days.

The stock with the biggest short ratio (days to cover), at 14.3 back then, was Heron Therapeutics, Inc. (HRTX). It rose by 9.5% in three days.

When you short a stock, it means that your goal is to make money from a drop in the price of a stock. Technically, what happens is that you borrow shares of a stock, sell those shares, then buy back those shares at a hopefully lower price so that those shares can be returned. This all happens electronically, so you don’t actually see all the borrowing and returning of shares; it just shows up on your screen as a negative number of shares.

Short sellers can be profitable, but sometimes when the stock moves against them, and begins to rise, the short sellers jump in right away to buy shares to cover their positions, creating what is called a short squeeze. When a short squeeze takes place, it can cause the share prices to increase fast and furiously. Any good news can trigger the short squeeze.

Some traders utilize this situation by looking for stocks to buy that may have a potential short squeeze. Here is what a short squeeze trader should take into consideration:

Short Percentage of Float ~ The float is the number of freely tradable shares and the short percentage is the number of shares held short divided by the float. Amounts over 10% to 20% are considered high and potential short squeeze plays.

Short Ratio / Days to Cover / Short Interest Ratio -This is probably the most important metric when looking for short squeeze trades, no matter what you call it. This is the number of days it would take the short sellers to cover their position based on the average daily volume of shares traded. This is a significant ratio as it shows how “stuck” the short sellers are when they want to buy in their shares without driving up the price too much. Unfortunately for the shortsellers, the longer the number of days to cover, the bigger and longer the squeeze.

Short Percentage Increase ~ This is the percentage increase in in the number of short sellers from the previous month.

The following are some heavily shorted tech stock that may be worth considering.

CompanyTickerShort % of FloatShort % ChangeShort Interest Ratio
Silvergate Capital CorpSI76.92%-6%1.2
Carvana CoCVNA52.82%0%1.8
Wayfair IncW33.65%0%4.2
Big Lots, Inc.BIG32.44%-1%7
C3.ai IncAI27.31%5%1.4
Fubotv IncFUBO26.57%-27%3.2
Virgin Galactic HoldingsSPCE25.92%9%5.9
Bakkt Holdings IncBKKT24.53%6%4.3
AMC EntertainmentAMC24.39%1%3.7
Cinemark Holdings, Inc.CNK23.73%0%7.6

The third stock on the list, Wayfair (W) has over 33% of its float shorted, with no change in short interest over last month.

The short interest ratio is 4.2, which means that it would take the short sellers over 4 days to cover their position, based on recent average volume.

Just keep in mind that just because a stock has good earnings ratios and is heavily shorted, doesn’t mean that the stock will go up, especially in a bear market. Also, stocks that are significantly shorted may be shorted for a reason.

Disclosure: Author didn’t own any of the above at the time the article was written.

How to Short a Stock by BUYING a Stock

 AXS Investments Launches First-Ever U.S. Suite of Single-Stock Leveraged Bull and Bear ETFs 

by Fred Fuld III 

Recently I wrote an article called 10 Ways to Make Money in a Bear Market. Well, now there is an additional way. You can now buy a single stock bearish ETF for certain stocks.

AXS Investments, a leading asset manager providing access to alternative investments for growth, income and diversification, today, July 14, 2022, launched a suite of eight ETFs that seek to provide leveraged long or inverse exposure to the daily performance of some of the most actively traded stocks across a variety of sectors. 

“We are thrilled to be the first firm to bring single-stock leveraged and inverse ETFs to U.S. investors,” said Greg Bassuk, CEO of AXS Investments. “With the launch of this highly innovative family of ETFs, AXS has once again opened new access for traders and sophisticated investors, namely to express their high-conviction views on some of the most actively traded single stocks, regardless of whether their sentiment is bullish or bearish. AXS is excited to continue our aggressive build-out of highly differentiated ETFs designed to provide investors with unique, first-of-their-kind investments to achieve their varying objectives.” 

The initial suite of AXS single-stock ETFs provides investors with leveraged long (“Bull”) and short (“Bear”) daily exposure to the following stocks: 

• Tesla: AXS TSLA Bear Daily ETF (TSLQ) 

• NVIDIA: AXS 1.25X NVDA Bear Daily ETF (NVDS) 

• PayPal: AXS 1.5X PYPL Bull Daily ETF (PYPT) and AXS 1.5X PYPL Bear Daily ETF (PYPS) 

• Nike: AXS 2X NKE Bull Daily ETF (NKEL) and AXS 2X NKE Bear Daily ETF (NKEQ) 

• Pfizer: AXS 2X PFE Bull Daily ETF (PFEL) and AXS 2X PFE Bear Daily ETF (PFES) 

As you can see, some of these ETFs have a leveraged bearish goal, such as Pfizer, which has a goal of providing two times the inverse of the daily performance of the price of the stock.

AXS Continues to Expand Fund Lineup with Fast-Growing Suite of First-of-Their-Kind Strategies. 

Today’s rollout of these new ETFs is just one of many major strategic growth initiatives successfully achieved by AXS.

“Whether it is powerful inflation fighting tools, ways to express views on innovation, or a host of other novel investments that previously were unavailable to investors, our goal remains to be the leader in providing investors with access to the tools needed to build portfolios and to trade effectively in today’s volatile markets,” continued Bassuk. “We’re very excited about today’s news, and all that we still have in our product pipeline for 2022 and beyond.” 

10 Ways to Make Money in a Bear market

by Fred Fuld III

Although the stock market has been rising for the last several days, some investors and traders believe that this rise is only temporary, and that we are in the beginning of a bear market. If you want to profit from downward markets and falling prices, there are many ways to do so.

Several techniques are available to make money in a bear market, some of which are speculative, and some not that risky. Even if you have a small account, there are ways to protect yourself, and even make money on the downside. Here are some of those strategies.

1. Sell a Vertical Call Option Spread

This strategy is a little complicated, but I listed it first, because it is one of the least risky, since your losses are limited, unlike most of the other strategies listed here. Also, I listed it at the beginning, because I use this trading technique all the time.

If you are familiar with options, then selling a vertical call spread is a great way to make money when a stock drops while protecting yourself if the stock goes up. (This happens to be my favorite strategy.)

This involves shorting an out of the money call option and buying a further out of the money call option at the same time. If the stock drops or stays the same, you make money from the short call which exceeds the loss on the long call. If the stock goes up to the strike price of the short call, you still make a profit. It is only when the stock rises above the strike price of the short call that you begin losing money.

To make it simple, here is an example:

Stock is at 50

Sell (short)  one call with a strike price of 51 for 3 (an option that is trading at 3 means $300)

Buy one call with a strike price of 52 for 1 ($100)

If the stock drops to 45, the 51 call drops to $0 and you make $300 because you shorted it, and the 52 call drops to $0 losing $100 because you own or were long it, netting you a profit of $200.

If the stock rises from 50 to 100, you lose $4900 on the 51 call that you shorted, but you make $4800 on the one that you bought, so you only lose $100.

Generally, you want to use options that expire in 40 to 60 days, and close out your position in 15 to 25 days.

Disadvantages of the selling a vertical call spread
  • Your profit is limited
  • You need approval from your broker to do option spreads
  • Both legs of the spread need to be placed simultaneously (easy to do with most trading platforms)
  • May need to wait 25 or 30 days to see a profit

2. Shorting Stocks

This is one of the most speculative ways of making money in a bear market. In simple terms, you make money when the stock goes down and you lose money when the stock goes up. What technically happens is that you borrow the shares and immediately sell them (this all is done electronically through your brokerage firm) and since you owe those shares, you eventually have to buy them back at some price, hopefully a lower price, in order to return those shares. The difference between your sale price and eventual purchase price is your profit (or loss, if you buy back at a higher price).

Can you make a lot of money shorting stocks in a bear market? Yes. Is it speculative? Very. Can you lose a lot? Most definitely. This is why it is so risky. When you short a stock, the lowest point it can drop to is zero. Whereas, if the stock goes up, the amount it can rise is unlimited. Let’s say you short 100 shares of a stock at $20 a share. If you put up funds equal to 100% of the value of the shorted amount, and the stock drops to zero, you’ve made a 100% return. However, suppose the stock goes from 20 to 100, you end up losing 400% of your money with lots of margin calls along the way. This is called a short squeeze. But even on a short term basis, an investor can lose money very fast.

Unfortunately for those who do their trading in retirement accounts, such as IRAs, shorting stocks is not allowed.

So in summery, do I think you should short stocks? Absolutely not, unless you are a professional trader. The risk is almost infinite. If you understand options real well, hedged short selling might be OK (see the next strategy), as long as you are an advanced trader, and know what you’re doing.

3. Hedged Short Selling

Hedged short selling is a strategy whereby you short a stock and at the same time, you buy a close-to-the-money call option. That way, if the stock shoots up, you are protected with the call option. If the stock drops, you will lose what you paid for the option, but you will make money on your short stock position.

Example: you short 100 shares of a stock that is currently trading at 50 (so you short $5000 in stock), and you buy a call option with a strike price of 52 for 1 ($100).

The stock goes to 40. You make $1000 from the stock dropping from 50 to 40, and you lose the $100 you paid for the call option, with a net profit of $900.

The stock stays the same at 50. You don’t make any money on the short sale fo the stock and you lose $100 on the call option for a net loss of $100.

The stock goes up to 60. You lose $1000 on the short stock, but the value of the call option will increase from 1 to 10 ($100 to $1000), netting $900 on the difference, for an overall loss of $100.

In other words, in the example above, you can only lose $100, if the stock stays the same or goes up, but if the stock drops, the profit can be substantial.

Actually, to be more accurate, if the stock goes to 51 and stays there, you will lose $100 on the short stock sale and $100 on the call option, for a total maximum loss of $200. Even still, it may be worth the small loss in case you are wrong about a bear market.

Disadvantages of the hedged short selling
  • You need approval from your broker to short stock and buy options
  • Both positions should be placed simultaneously (easy to do with most trading platforms)

4. Short (Bearish) ETFs

The Exchange Traded Fund known as the Bearish ETF or Short ETF is another option. What these ETFs do is provide a return opposite to the return of the index, sector, or industry that it is tracking.

For example, the Short Dow30 ProShares (DOG) provides a return that is the inverse of the Dow Jones Industrial Average. If the Dow goes down 2%, the DOG is expected to up 2%. The Short QQQ ProShares (PSQ) ETF gives a return that is the inverse of the NASDAQ 100 Index.

The nice thing about these short ETFs is that your losses are limited. Also, if you are long individual stocks that you don’t want to sell, these can be good for protecting your overall portfolio on the downside.

5. Leveraged Bearish ETFs

If you like volatility, you will love the leveraged bearish ETFs. What these ETFs do is provide double, and in some cases triple the inverse return of indices.Some examples include the UltraShort Consumer Services ProShares (SCC) and the ProShares UltraShort S&P S&P 500 (SDS).

In addition there are several triple leveraged bearish ETFs. Direxion Daily MCSI Real Estate Bear 3X Shares (DRV), Direxion Daily Energy Bear 2X Shares (ERY), and ProShares UltraPro Short Russell 2000 (SRTY) are just a few of the many leveraged bearish ETFs.

The volatility of these ETFs is substantial, and so are the wide bid and asked spreads that I’ve seen occasionally.

The advantage of these trading vehicles is that they are a way of shorting on margin, with a limit on the downside. The disadvantage is that the losses can be quick and large, especially with the triple leverage short ETFs.

6. Bear Funds

It may be hard to believe, but there are actually a large number of bearish mutual funds for the long term bearish investors. These include the Grizzly Short Fund (GRZZX), the PIMCO StocksPlus TR Short Strategy Institutional Fund (PSTIX), and the ProFunds Bear Investors Fund (BRPIX). These funds have minimum investments ranging from $1,000 to $5,000,000.

7. Puts

First, a little about option pricing.  Puts and calls are priced on a per share basis, so a put at $1 would cost $100 for a 100 share option, or a call at $3.50 would cost $350.

A put is the option to put your stock to someone at a particular price within a certain period of time. In other words, if you own a stock that is trading at 22 and you buy a put at a dollar which gives you the right to put your stock to someone at $20 per share within three months, there are a couple of things that could happen. The stock could tank to $14 a share and you could put your stock at 20, or just resell the put for 6 (the difference between 14 and 20) and collecting the profit. You would be far better off than just doing nothing. And if the stock goes up or stays about the same, you are just out your $100 for the option. Puts can be useful for experienced traders.

8. Cash

There is one other way to make money in a bear market. Sell everything, and keep your money in cash, with the safest way being a T-bill money market fund, that only owns T-bills. (Money market funds that invest in repos are supposed to be just as safe, but I consider them slightly more risky than T-bills.) The advantages are that you can’t lose money and you can receive an income from the investment.

The alternative cash investment is putting your money in a bank certificate of deposit or savings account. Your money is safe up to the FDIC limits, but the interest rate will be very low.

9. Anti ETFs

The Anti-ETF is a new investment vehicle that has cropped up recently. The goal of these ETFs is to provide the reverse return of another popular actively managed exchange traded fund, as opposed to the bearish ETF which attempt to track the inverse of an index, like the ProShares Short S&P500 ETF (SH).

The most popular is the Tuttle Capital Short Innovation ETF (SARK), which has a goal of achieving the inverse of the return of the popular ARK Innovation ETF (ARKK) managed by Cathie Wood.

10. Series I Bonds

If you think the bear market will last for a year or more, Series I bonds are the way to go. These bonds never drop in value and currently pay 9.62%. Plus, they are backed by the U.S. Government. For more information on these bonds, check out the article Series I Bonds Now Paying over 9%.

There are obviously additional risks involved with shorting stock and options, which you need to delve into with your broker before utilizing those strategies. If we are in a bear market, hopefully you can protect your portfolio and make some money on the downside.

Author does not own any of the above mentioned securities.

Top Travel Stocks Short Squeeze Plays

by Fred Fuld III

Many stocks in the travel industry have suffered during the last three years due to the COVID pandemic. Some have lost over 50% of their value since 2019. As the market prices for these stocks have dropped so much, now might be the time to look for short squeeze opportunities.

Here is a quick review about the short squeeze and its terminology. When you short a stock, it means that your goal is to make money from a drop in the price of a stock. Technically, what happens is that you borrow shares of a stock, sell those shares, then buy back those shares at a hopefully lower price so that those shares can be returned. This all happens electronically, so you don’t actually see all the borrowing and returning of shares; it just shows up on your screen as a negative number of shares.

Short selling can be profitable, but sometimes when the stock moves against the short sellers, and begins to rise, the short sellers jump in right away to buy shares to cover their positions, creating what is called a short squeeze. When a short squeeze takes place, it can cause the share prices to increase fast and furiously. Any good news can trigger the short squeeze.

Some traders utilize this situation by looking for stocks to buy that may have a potential short squeeze. Here is what a short squeeze trader should take into consideration:

Short Percentage of Float ~ The float is the number of freely tradable shares and the short percentage is the number of shares held short divided by the float. Amounts over 10% to 20% are considered high and potential short squeeze plays.

Short Ratio / Days to Cover / Short Interest Ratio -This is probably the most important metric when looking for short squeeze trades, no matter what you call it. This is the number of days it would take the short sellers to cover their position based on the average daily volume of shares traded. This is a significant ratio as it shows how “stuck” the short sellers are when they want to buy in their shares without driving up the price too much. Unfortunately for the shortsellers, the longer the number of days to cover, the bigger and longer the squeeze.

Short Percentage Increase ~ This is the percentage increase in in the number of short sellers from the previous month.

Check out the following list, but be aware, that often some stocks are heavily shorted for a reason. All these stocks have significant short metrics, but they have very low market caps and floats.

Company Symbol Days to Cover % of Float Shorted
Carnival Corporation & plc CCL 2 10%
Expedia Group, Inc. EXPE 2.9 5%
Lindblad Expeditions Holdings, Inc. LIND 23.9 19%
Norwegian Cruise Line Holdings Ltd. NCLH 1.6 10%
Royal Caribbean Cruises Ltd. RCL 2.9 6%
TripAdvisor, Inc. TRIP 4 12%

So as an example, Carnival has 10% of the float shorted, and it will take two days for the short sellers to cover their positions, based on the average daily volume.

Obviously, there is no guarantee that these stocks will go up, but if I was short any stock, I wouldn’t want to waste any time covering my position if the stock started to move up sharply, before all the other short sellers clamor in and drive the price way up.

Disclosure: Author has a short and long option position in CCL.

Heavily Shorted Debt Free Stocks

by Fred Fuld III

Many of the meme stocks, such as GameStop (GME) and AMC (AMC), have shot up in price several times because of the fact that they have been heavily shorted and subject to a short squeeze.

So if you are looking for other heavily shorted stocks, you might want to check out the stocks which have a large portion of their float shorted, and in addition, have low or no debt. If a company has no debt, it is hard for them to go out of business.

Here is a review of the short squeeze and its terminology. When you short a stock, it means that your goal is to make money from a drop in the price of a stock. Technically, what happens is that you borrow shares of a stock, sell those shares, then buy back those shares at a hopefully lower price so that those shares can be returned. This all happens electronically, so you don’t actually see all the borrowing and returning of shares; it just shows up on your screen as a negative number of shares.

Short selling can be profitable, but sometimes when the stock moves against the short sellers, and begins to rise, the short sellers jump in right away to buy shares to cover their positions, creating what is called a short squeeze. When a short squeeze takes place, it can cause the share prices to increase fast and furiously. Any good news can trigger the short squeeze.

Some traders utilize this situation by looking for stocks to buy that may have a potential short squeeze. Here is what a short squeeze trader should take into consideration:

Short Percentage of Float ~ The float is the number of freely tradable shares and the short percentage is the number of shares held short divided by the float. Amounts over 10% to 20% are considered high and potential short squeeze plays.

Short Ratio / Days to Cover / Short Interest Ratio -This is probably the most important metric when looking for short squeeze trades, no matter what you call it. This is the number of days it would take the short sellers to cover their position based on the average daily volume of shares traded. This is a significant ratio as it shows how “stuck” the short sellers are when they want to buy in their shares without driving up the price too much. Unfortunately for the shortsellers, the longer the number of days to cover, the bigger and longer the squeeze.

Short Percentage Increase ~ This is the percentage increase in in the number of short sellers from the previous month.

Check out the following list, but be aware, that often some stocks are heavily shorted for a reason. All these stocks have significant short metrics.

Big 5 Sporting Goods (BGFV) has over 45% of its float shorted and no long term debt. The percentage shorted has increased by 15% over last month. In addition, the stock has a short interest ratio, also known as a Days to Cover Ratio, of 5.9. This means that it would take almost six days for short sellers to cover their position, based on recent volume. The stock trades at 5.5 times trailing earnings. It is a sporting goods retailer in the western United States.

OppFi Inc. (OPFI) has 12.3$ of its float shorted. The short entered has had a one month increase of 6% and a short interest ratio of 4.4. The company operates a financial technology platform.

Sunlight Financial Holdings (SUNL) is another debt free company that has over 10% of of its float shorted. The percentage shorted has increased by 9% over last month. Plus, the stock has a short interest ratio of 6.0. The company provides a financing platform for solar installation.

Happy squeezing!

Stocks with the Highest Short Interest: Short Squeeze Plays

by Fred Fuld III

As I write this, the Dow Jones Industrial  Average is down 477, and the S&P is also down. Maybe while the market has dropped so much, now might be the time to look for short squeeze opportunities.

Here is a review about the short squeeze and its terminology. When you short a stock, it means that your goal is to make money from a drop in the price of a stock. Technically, what happens is that you borrow shares of a stock, sell those shares, then buy back those shares at a hopefully lower price so that those shares can be returned. This all happens electronically, so you don’t actually see all the borrowing and returning of shares; it just shows up on your screen as a negative number of shares.

Short selling can be profitable, but sometimes when the stock moves against the short sellers, and begins to rise, the short sellers jump in right away to buy shares to cover their positions, creating what is called a short squeeze. When a short squeeze takes place, it can cause the share prices to increase fast and furiously. Any good news can trigger the short squeeze.

Some traders utilize this situation by looking for stocks to buy that may have a potential short squeeze. Here is what a short squeeze trader should take into consideration:

Short Percentage of Float ~ The float is the number of freely tradable shares and the short percentage is the number of shares held short divided by the float. Amounts over 10% to 20% are considered high and potential short squeeze plays.

Short Ratio / Days to Cover / Short Interest Ratio -This is probably the most important metric when looking for short squeeze trades, no matter what you call it. This is the number of days it would take the short sellers to cover their position based on the average daily volume of shares traded. This is a significant ratio as it shows how “stuck” the short sellers are when they want to buy in their shares without driving up the price too much. Unfortunately for the shortsellers, the longer the number of days to cover, the bigger and longer the squeeze.

Short Percentage Increase ~ This is the percentage increase in in the number of short sellers from the previous month.

Check out the following list, but be aware, that often some stocks are heavily shorted for a reason. All these stocks have significant short metrics.

Stock Symbol % Float Shorted Days to Cover Stock Price
Workhorse WKHS 35% 2.2 8.97
Arcimoto FUV 34% 5.4 10.94
Blink BLNK 34% 6.2 30.09
Support.com SPRT 33% 1.5 8.31

So as an example, Arcimoto has 34% of the float shorted, and it will takeover five days for the short sellers to cover their positions, based on the average daily volume.

Obviously, there is no guarantee that these stocks will go up, but if I was short any stock, I wouldn’t want to waste any time covering my position if the stock started to move up sharply, before all the other short sellers clamor in and drive the price way up.

Disclosure: Author didn’t own any of the above at the time the article was written

Top Short Interest Analyzers

by Fred Fuld III

NASDAQ has a service on their site which allows you to check on the short interest on any NASDAQ stock for any month.

For example, if you enter Sundial (SNDL) [short interest is measured on the 15th of every month], you come up with the fact that the short interest is 267,716,798 shares, an increase of 4.47% from the prior month, with an average daily share volume of 208,079,855 and 1.29 days to cover.

For NYSE stocks, such as GameStop (GME) and AMC (AMC), check out Shortsqueeze.com. It will give you the following:
Short Interest Ratio (Days To Cover)
Short Percent of Float
Short % Increase / Decrease
Short Interest (Current Shares Short)
Shares Float
Short Interest (Prior Shares Short)

There is also a website called Shortinterest.com which shows the top shorted stocks.

Disclosure: Author owns SNDL.

Top Short Squeeze Stocks

by Fred Fuld III

Remember when GameStop (GME) went up over 700% in five days due to a short squeeze? The movie theater chain, AMC (AMC) increased by over 1,000% in ten days from a short squeeze.

Here is a review about the short squeeze and its terminology. When you short a stock, it means that your goal is to make money from a drop in the price of a stock. Technically, what happens is that you borrow shares of a stock, sell those shares, then buy back those shares at a hopefully lower price so that those shares can be returned. This all happens electronically, so you don’t actually see all the borrowing and returning of shares; it just shows up on your screen as a negative number of shares.

Short selling can be profitable, but sometimes when the stock moves against the short sellers, and begins to rise, the short sellers jump in right away to buy shares to cover their positions, creating what is called a short squeeze. When a short squeeze takes place, it can cause the share prices to increase fast and furiously. Any good news can trigger the short squeeze.

Some traders utilize this situation by looking for stocks to buy that may have a potential short squeeze. Here is what a short squeeze trader should take into consideration:

Short Percentage of Float ~ The float is the number of freely tradable shares and the short percentage is the number of shares held short divided by the float. Amounts over 10% to 20% are considered high and potential short squeeze plays.

Short Ratio / Days to Cover / Short Interest Ratio -This is probably the most important metric when looking for short squeeze trades, no matter what you call it. This is the number of days it would take the short sellers to cover their position based on the average daily volume of shares traded. This is a significant ratio as it shows how “stuck” the short sellers are when they want to buy in their shares without driving up the price too much. Unfortunately for the shortsellers, the longer the number of days to cover, the bigger and longer the squeeze.

Short Percentage Increase ~ This is the percentage increase in in the number of short sellers from the previous month.

Check out the following list, but be aware, that often some stocks are heavily shorted for a reason. All these stocks have significant short metrics.

Stock Symbol % Float Shorted Days to Cover Stock Price
PubMatic Inc. PUBM 45.53% 4.3 36.43
Esperion Therapeutics ESPR 41.16% 14 22.32
Ontrak Inc. OTRK 39.69% 3.3 31.71
Blink Charging Co. BLNK 37.78% 2 30.94

So as an example, Esperion has over 41% of the float shorted, and it will take 14 days for the short sellers to cover their positions, based on the average daily volume.

Obviously, there is no guarantee that these stocks will go up, but if I was short any stock, I wouldn’t want to waste any time covering my position if the stock started to move up sharply, before all the other short sellers clamor in and drive the price way up.

Disclosure: Author didn’t own any of the above at the time the article was written.

Top Low Priced Short Squeeze Stocks

by Fred Fuld III

Unless you haven’t paid any attention to financial news at all, you probably already know that GameStop (GME) has gone up over 700% in the last five days. The movie theater chain, AMC (AMC) was available for a little over two bucks ten days ago. Today, it traded for 25.80 this morning in pre-market trading.

You also probably know that these huge gains have been caused by short squeezes.  Back on September 18 last year, I published an article called Top Restaurant Short Squeeze Stocks, and it listed four companies that were heavily shorted. In just the last four months, those stocks have had stellar returns.

The worst performing stock was up 38%. Not a bad return for four months. The best performing was Dave & Busters (PLAY), which was up 138%. Here are those four stocks, with the percent of float shorted at the time, the days to cover at the time, and the return if you had bought the stock back then and sold today.

Stock Symbol % of Float Days to Cover % Gain
Shake Shack SHAK 26% 5.7 85%
Dave & Buster’s PLAY 33% 1.8 136%
Red Robin RRGB 35% 3.4 64%
El Pollo Loco LOCO 19% 11.2 38%

Many of the heavily shorted stocks you have seen on the news during the last couple days are high priced, with a majority of them trading over $100 a share. That’s a lot of risk. So If you are looking for low priced stocks that might be short squeeze plays, I will cover that shortly.

But first, a review about the short squeeze and its terminology. When you short a stock, it means that your goal is to make money from a drop in the price of a stock. Technically, what happens is that you borrow shares of a stock, sell those shares, then buy back those shares at a hopefully lower price so that those shares can be returned. This all happens electronically, so you don’t actually see all the borrowing and returning of shares; it just shows up on your screen as a negative number of shares.

Short selling can be profitable, but sometimes when the stock moves against the short sellers, and begins to rise, the short sellers jump in right away to buy shares to cover their positions, creating what is called a short squeeze. When a short squeeze takes place, it can cause the share prices to increase fast and furiously. Any good news can trigger the short squeeze.

Some traders utilize this situation by looking for stocks to buy that may have a potential short squeeze. Here is what a short squeeze trader should take into consideration:

Short Percentage of Float ~ The float is the number of freely tradable shares and the short percentage is the number of shares held short divided by the float. Amounts over 10% to 20% are considered high and potential short squeeze plays.

Short Ratio / Days to Cover / Short Interest Ratio -This is probably the most important metric when looking for short squeeze trades, no matter what you call it. This is the number of days it would take the short sellers to cover their position based on the average daily volume of shares traded. This is a significant ratio as it shows how “stuck” the short sellers are when they want to buy in their shares without driving up the price too much. Unfortunately for the shortsellers, the longer the number of days to cover, the bigger and longer the squeeze.

Short Percentage Increase ~ This is the percentage increase in in the number of short sellers from the previous month.

Check out the following list, but be aware, that often some stocks are heavily shorted for a reason. All these stocks have significant short metrics.

Stock Symbol % of Float Days to Cover Stock Price
Ayro AYRO 23.28% 0.51 7.24
Clovis Oncology CLVS 42.43% 6.54 7.94
Senseonics SENS 30.95% 1.36 2.51
TherapeuticsMD TXMD 28.89% 14.30 1.59
VBI Vaccines VBIV 25.64% 6.62 3.15

So as an example, VBI Vaccines has over 25% of the float shorted, and it will take over six days for the short sellers to cover their positions, based on the average daily volume.

Obviously, there is no guarantee that these stocks will go up, but if I was short any stock selling for less than $10 a share, I wouldn’t want to waste any time covering my position, before all the other short sellers clamor in and drive the price way up.

Disclosure: Author owns TXMD. No recommendations are express or implied.