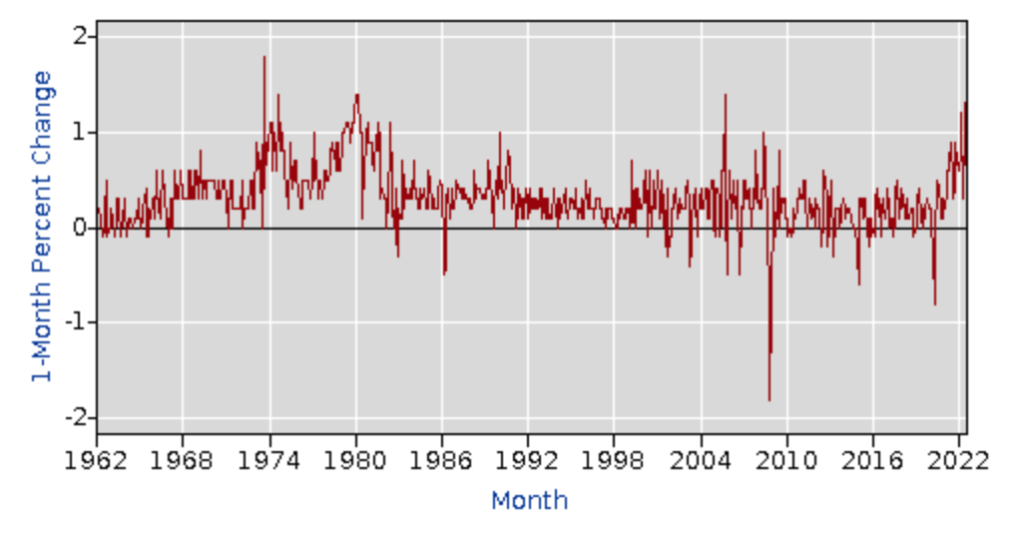
The CPI for all urban consumers, one month percent change:

WStNN.com™ WallStreetNewsNetwork® Stockerblog™ WSNN®
Wall Street News Network: Information on stocks, bonds, real estate, investments, gold, startups, & money
The CPI for all urban consumers, one month percent change:
by Fred Fuld III
I’m sure you have noticed prices increasing, not just at the pump. But do you know what items have had the biggest price increases?
The following is a list of items with the biggest price increases according the the U.S. Bureau of Labor Statistics. These are the ones with a price boost of greater than 20%. year-over-year.
| Fuel oil | 43.6% |
| Gasoline, unleaded regular | 38.7% |
| Gasoline, unleaded midgrade | 35.6% |
| Gasoline, unleaded premium | 33.3% |
| Other motor fuels | 40.5% |
| Utility (piped) gas service | 23.8% |
| Used cars and trucks | 41.2% |
| Lodging away from home | 25.1% |
| Other lodging away including hotels and motels | 29% |
| Car and truck rental | 24.3% |
| Admission to sporting events | 20.9% |
| Private transportation | 22.1% |
| New and used motor vehicles | 23.5% |
You will notice that average prices of used cars and trucks is up an incredible 41.2%. Admission to sporting events was up “only” 20.9%.
Hang on. These increases are only the beginning.
By the way, the picture shown with this article is way out of date. It is from four months ago. Prices in California are much higher now.