Stocks Going Ex Dividend in December 2024

The following is a short list of some of the many stocks going ex-dividend during the next month, which can be helpful for traders and investors interested in the stock trading technique known as “Buying Dividends” or “Dividend Capture.” This strategy involves purchasing stocks before the ex dividend date and selling them shortly after the ex-date at a similar price, while still being eligible to receive the dividend payment.

Although this technique generally proves effective in bull markets and flat or choppy markets, it is advisable to exercise caution and consider avoiding this strategy during bear markets. To qualify for the dividend, it is necessary to buy the stock before the ex-dividend date and refrain from selling it until on or after the ex-date.

However, it is important to note that the actual dividend may not be paid for several weeks, as the payment date can be delayed by up to two months after the ex-date.

For investors seeking a comprehensive list of stocks going ex-dividend in the near future, WallStreetNewsNetwork.com has compiled a downloadable list containing numerous dividend-paying companies. Here are a few examples showcasing the stock symbol, ex-dividend date, periodic dividend amount, and annual yield.

Nike, Inc. (NKE)12/2/20240.402.07%
PepsiCo, Inc. (PEP)12/6/20241.3553.35%
The Travelers Companies, Inc. (TRV)12/10/20241.051.60%
Thermo Fisher Scientific Inc (TMO)12/13/20240.390.30%
Phillips Edison & Company, Inc. (PECO)12/16/20240.10253.13%
Southwest Airlines Company (LUV)12/26/20240.182.25%
Xerox Holdings Corporation (XRX)12/31/20240.2511.06%

To access the entire list of over 100 ex-dividend stocks, subscribers will receive an email in the next couple days with the full list. If you are not already a subscriber, you can sign up using the provided signup box below. Don’t miss out on this valuable information, and the best part is that it’s free!

Dividend Definitions

To better understand the dividend-related terms, let’s define them:

Declaration date: This refers to the day when a company announces its intention to distribute a dividend in the future.
Ex-dividend date: On this day, if you purchase the stock, you would not be eligible to receive the upcoming dividend. It is also the first day on which a shareholder can sell their shares and still receive the dividend.
Record date: This marks the day when you must be recorded on the company’s books as a shareholder to qualify for the dividend. Typically, the ex-dividend date is set two business days prior to the record date.
Payment date: This is the day on which the dividend payment is actually made to the eligible shareholders. It’s important to note that the payment date can be as long as two months after the ex-date.

Before implementing the “Buying Dividends” technique, it is crucial to reconfirm the ex-dividend date with the respective company to ensure accuracy and avoid any unexpected changes.

In conclusion, being aware of the stocks going ex-dividend can be advantageous for traders and investors employing the “Buying Dividends” strategy. WallStreetNewsNetwork.com provides a convenient resource to access a comprehensive list of such stocks, allowing individuals to plan their investment decisions effectively. Remember to stay informed and consider market conditions before employing any investment strategy.

Disclosure: Author owns PEP.

Is Your Stock Manipulating Its Earnings? Easy Way to Check Tesla, Super Micro Computer Computer, and Many Others

by Fred Fuld III

The Beneish M-Score is a financial metric designed to identify the likelihood that a company has engaged in earnings manipulation. Developed by Professor Messod Beneish of Indiana University, the M-Score uses a combination of financial ratios and variables to flag irregularities in accounting practices. Since its introduction in the late 1990s, it has become a critical tool for auditors, investors, and analysts who aim to evaluate the authenticity of a company’s financial reporting.

At its core, the Beneish M-Score combines eight variables, derived from publicly available financial statements, to create a composite score. These variables include metrics like the Days Sales in Receivables Index (DSRI), which measures changes in the relationship between receivables and sales, and the Gross Margin Index (GMI), which compares a company’s gross margin over time. Others, like the Asset Quality Index (AQI) and the Total Accruals to Total Assets Ratio (TATA), further analyze a firm’s asset structure and discretionary accounting practices.

The calculation results in a score that typically falls into one of two categories: firms with an M-Score less than -2.22 are considered less likely to manipulate earnings, while those with an M-Score higher than this threshold warrant further scrutiny.

I want to make sure you understand completely how this score works. It is always calculated as a negative number. The lower the negative number, the less likely the accounting is being manipulated. The higher the number, in other words, the smaller the negative number, the chances are greater that manipulation is involved.

A rule of thumb is that if the M-Score is -2.00 or lower, a greater NEGATIVE number, such as -2.50 or -3.00, the company is not a manipulator. If the score falls into the range of -2.00 to -1.78, the company is a possible manipulator. If the score is -1.78 to zero, it is a likely manipulator.

Although the M-Score does not definitively prove manipulation, it raises red flags, signaling that a company’s financial activities may require deeper investigation.

One of the most famous cases illustrating the power of the Beneish M-Score involved Enron. Retrospective analyses revealed that the M-Score flagged the company as a high-risk manipulator well before its infamous collapse. This case demonstrated the score’s potential as a forward-looking tool, though it also highlighted its reliance on accurate and consistent data from company filings.

Despite its utility, the Beneish M-Score has limitations. It is primarily designed for manufacturing or industrial firms and may be less effective in service-oriented or financial sectors, where the nature of financial reporting differs significantly. Furthermore, the M-Score is sensitive to accounting anomalies, which may not necessarily indicate deliberate manipulation but rather reflect differences in industry practices, acquisitions, or rapid growth.

For investors and analysts, the Beneish M-Score should be viewed as a starting point rather than a definitive verdict. It is most effective when used alongside other analytical tools and qualitative assessments. When combined with careful evaluation of a company’s leadership, industry trends, and broader financial metrics, the M-Score can serve as a valuable part of a due diligence process.

If you want to try the M-Score on a stock you are interested in, you can go to the M-Score Calculator, which is hosted by Indiana University, and try it on your own.

I tried it with a couple of stocks and this is what I came up with.

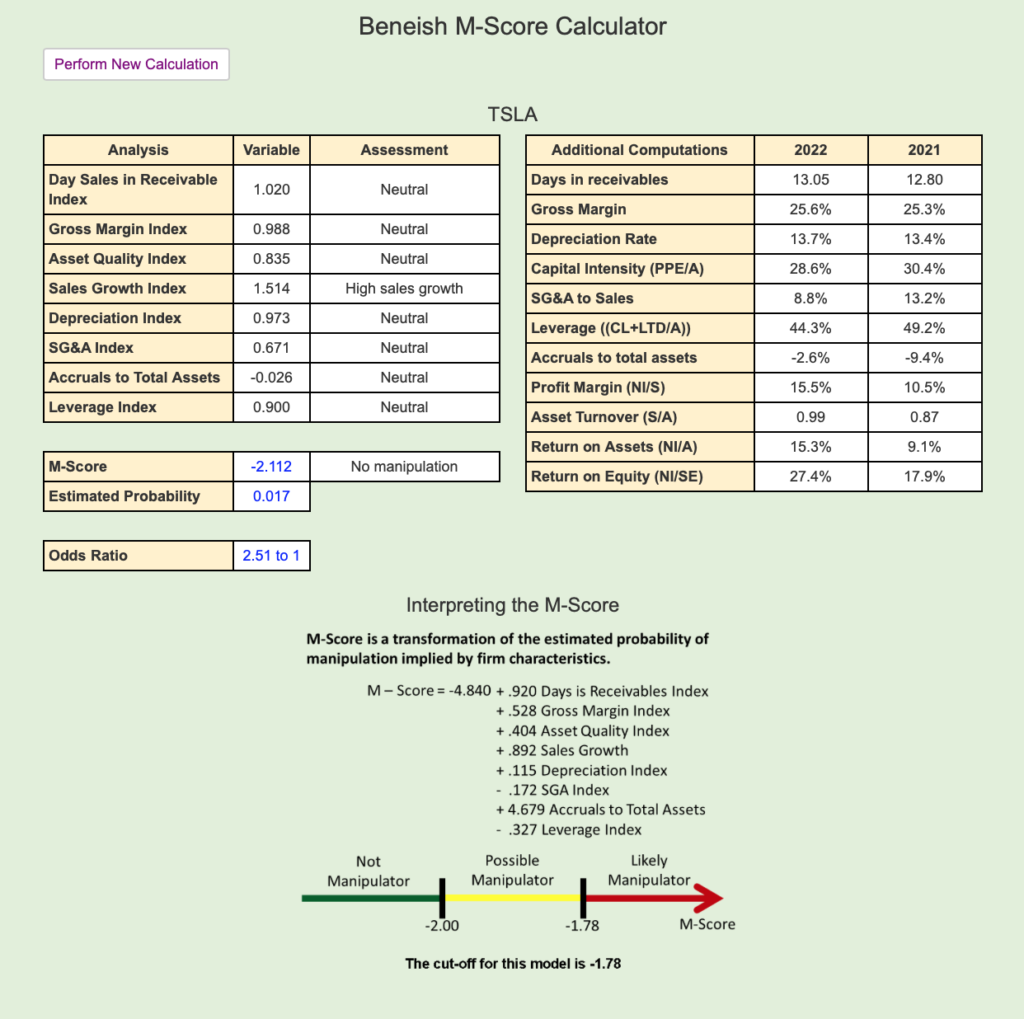
First, I started with Tesla (TSLA).

Tesla ended up with an M-Score of -2.112, a score of less than -2.00 (a greater negative number that -2.00), which means it falls in the green Not a Manipulator category.

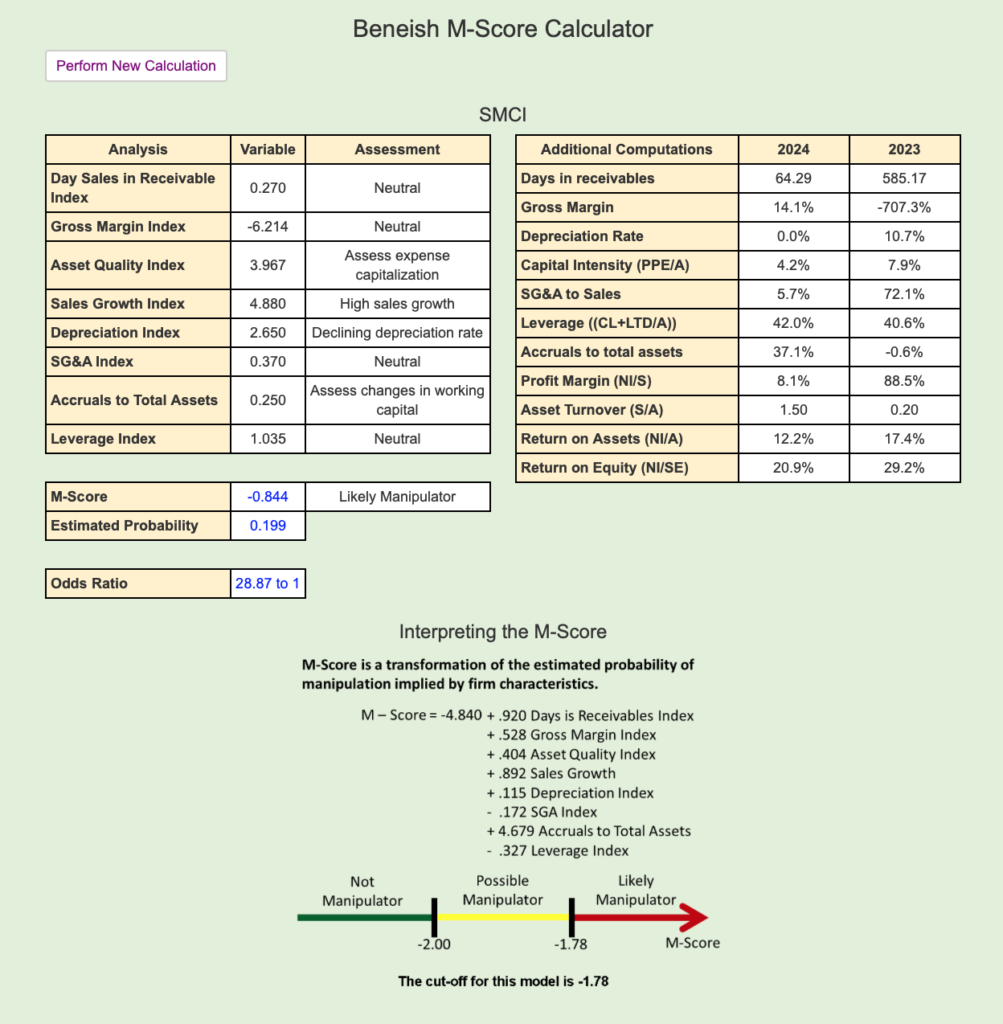
Then I tried Super Micro Computer (SMCI):

You have probably seen the news lately about SNCI.

  • Accounting Firm Resignation: In October 2024, Ernst & Young resigned as Super Micro’s auditor, citing concerns about transparency and internal controls related to financial reporting.   
  • Delayed Annual Report: Super Micro delayed the filing of its annual report, leading to a significant drop in its stock price.   
  • Hindenburg Research Report: Hindenburg Research published a report alleging that Super Micro continued to engage in accounting manipulation, sibling self-dealing, and potential sanctions evasion.   

These recent events have raised serious concerns about the accuracy and reliability of Super Micro’s financial reporting. Investors and analysts are closely monitoring the situation as the company works to address these issues and regain credibility.

So what did the M-Score Calculator show for Super Micro? It displayed an M-Score of -0.844, a higher number than -1.78 (lower negative number), based on the. This puts it well in the range of red Likely Manipulator.

In today’s complex financial landscape, where trust in corporate reporting is paramount, tools like the Beneish M-Score play a crucial role. By offering a quantitative approach to identifying irregularities, it empowers stakeholders to make informed decisions, promoting greater accountability in corporate governance.

Disclosure: Author owns a small amount of TSLA.

Dressing for Success: Why Apparel Stocks Could Be a Holiday Season Winner

by Fred Fuld III

Reading time: 2 minutes

As the holiday season approaches, investors may want to consider adding apparel and clothing retailer stocks to their portfolios. This sector often sees a boost during the holiday shopping season, as consumers seek out festive attire and gifts for loved ones. Let’s delve into three potential investment opportunities within this space: American Eagle Outfitters (AEO), Buckle (BKE), and Gap (GAP).   

American Eagle Outfitters (AEO)

American Eagle Outfitters, known for its trendy and affordable apparel, has a strong track record of appealing to young consumers. The company’s diverse brand portfolio, including Aerie, has contributed to its consistent growth. 

With a market cap of $3.42 billion, a P/E ratio of 15, and a forward P/E of 9, AEO presents an intriguing investment opportunity. The stock has a very favorable price to sales ratio of 0.63 (remember, the lower the number, the better), and pays a dividend of 2.57%.

Buckle (BKE)

Buckle, a specialty retailer focused on denim and casual apparel, has a loyal customer base and a strong brand reputation. The company’s focus on quality products and excellent customer service has driven its success.

With a market cap of $2.27 billion, a P/E ratio of 11, and a forward P/E of 12, BKE could be a solid choice for investors seeking exposure to the denim market. The stock has a price sales ratio of 1.85 which is a bit on the high side, and a trailing dividend yield of 3.1%.

Gap (GAP)

Gap, a well-established retailer with a diverse portfolio of brands, including Gap, Old Navy, and Banana Republic, has been undergoing a transformation to adapt to changing consumer preferences. The company’s efforts to improve its online presence and offer more fashionable and inclusive clothing have shown promise.

With a market cap of $8.35 billion, and a trailing and a forward P/E of 11, GAP could benefit from the holiday shopping season and its ongoing turnaround efforts. The stock sports a couple of excellent financial ratios, a price/sales of 0.55, and an outstanding price to earnings growth ratio of 0.23. The yield is 2.67%.

Key Considerations

While the apparel and clothing retail sector holds promise for the holiday season, it’s essential to consider the following factors before investing:

  • Economic Conditions: A strong economy and consumer confidence are crucial for the sector’s performance.
  • Competitive Landscape: Increased competition from online retailers and fast fashion brands can impact sales and profitability.
  • Inventory Management: Effective inventory management is vital to avoid markdowns and excess stock.   
  • Consumer Preferences: Staying updated on evolving fashion trends and consumer preferences is essential.

By carefully evaluating these factors and conducting thorough research, investors can make informed decisions about investing in apparel and clothing retailer stocks during the holiday season.

Disclosure: Author didn’t own any of the above at the time the article was written.

Drilling for Oil Drilling Stocks

by Fred Fuld III

Reading time: 4 minutes

The oil and gas industry has experienced significant fluctuations in recent years, influenced by various factors such as geopolitical tensions, fluctuating demand, and the rise of renewable energy. Despite these challenges, oil and gas remain crucial components of the global energy mix, particularly for emerging economies.

Global oil demand is projected to remain robust, driven by factors like increasing population and industrialization in developing nations. Additionally, the Organization of the Petroleum Exporting Countries (OPEC) and other major producers have shown a commitment to maintaining price stability, which can benefit oil drilling companies.

Technological advancements, such as hydraulic fracturing and horizontal drilling, have unlocked new reserves and improved production efficiency. Deep-sea exploration and production capabilities continue to evolve, expanding the potential resource base.

Many oil drilling companies offer substantial dividend yields and share buyback programs, which can enhance shareholder value.

While the oil and gas industry is inherently volatile, subject to fluctuations in commodity prices and geopolitical events, there are also significant risks associated with environmental concerns and the long-term transition to renewable energy sources.

For investors considering oil drilling stocks, it is essential to carefully evaluate the risks and rewards. Major drilling companies, oilfield service providers, and independent oil and gas producers are key players in the industry.

Helmerich & Payne (HP):

Helmerich & Payne is a leading provider of drilling solutions and technologies. The company operates a fleet of advanced drilling rigs, primarily focused on the North American market. HP’s strong focus on technological innovation and operational efficiency has positioned it as a key player in the oil and gas industry.

The stock trades at 11 times trailing earnings and 10 times forward earnings. The stock has a dividend estimate for the current fiscal year at 4.0%.

Noble Corp. (NE):

Noble Corp. is a global offshore drilling contractor, operating a fleet of high-specification drillships and semisubmersible rigs. The company serves a diverse customer base, including major international oil and gas companies. Noble Corp. is known for its commitment to safety, environmental responsibility, and operational excellence.

The stock has a trailing and forward price to earnings ratio of 10, and earnings per share are expected to grow by 14% next year. Noble pays a dividend yield of 5.1%

Patterson-UTI (PTEN):

Patterson-UTI is a leading land drilling contractor, providing drilling services to oil and gas exploration and production companies in the United States. The company operates a fleet of high-performance drilling rigs and offers a range of complementary services, including pressure pumping and rental tools. PTEN’s strong focus on customer service and operational efficiency has contributed to its success.

The company has been generating negative earnings, and has a sky high forward PE ratio of 283. The stock’s yield is 3.7%.

Sable Offshore (SOC):

Sable Offshore is a relatively smaller player in the offshore drilling industry, specializing in providing services to the Brazilian offshore market. The company operates a fleet of modern drilling rigs and has a strong track record of delivering safe and efficient drilling operations.

The stock has been generating negative earnings but has a forward PE of 10. The company does not pay a dividend.

Why Invest in Oil Drilling Stocks?

  1. Strong Demand and Price Stability:
    • Global Demand: Despite the growth of renewable energy, global oil demand is projected to remain robust, driven by factors like increasing population and industrialization in developing nations.
    • Price Stability: The Organization of the Petroleum Exporting Countries (OPEC) and other major producers have shown a commitment to maintaining price stability, which can benefit oil drilling companies.   
  2. Technological Advancements:
    • Enhanced Recovery Techniques: Innovative technologies like hydraulic fracturing and horizontal drilling have unlocked new reserves and improved production efficiency.   
    • Offshore Exploration: Deep-sea exploration and production capabilities continue to evolve, expanding the potential resource base.
  3. Dividends and Share Buybacks:
    • Attractive Returns: Many oil drilling companies offer substantial dividend yields and share buyback programs, which can enhance shareholder value.   

Potential Risks and Considerations:

  • Volatility: The oil and gas industry is inherently volatile, subject to fluctuations in commodity prices and geopolitical events.   
  • Environmental Concerns: Growing environmental awareness and stricter regulations can impact operations and costs.
  • Transition to Renewable Energy: Long-term, the transition to renewable energy sources could reduce demand for fossil fuels.

In conclusion, while the future of the oil and gas industry is evolving, there remains a strong case for investing in oil drilling stocks, particularly for investors with a long-term perspective.

Disclosure: Author didn’t own any of the above at the time the article was written.

Stocks Going Ex Dividend in November 2024

The following is a short list of some of the many stocks going ex-dividend during the next month, which can be helpful for traders and investors interested in the stock trading technique known as “Buying Dividends” or “Dividend Capture.” This strategy involves purchasing stocks before the ex dividend date and selling them shortly after the ex-date at a similar price, while still being eligible to receive the dividend payment.

Although this technique generally proves effective in bull markets and flat or choppy markets, it is advisable to exercise caution and consider avoiding this strategy during bear markets. To qualify for the dividend, it is necessary to buy the stock before the ex-dividend date and refrain from selling it until on or after the ex-date.

However, it is important to note that the actual dividend may not be paid for several weeks, as the payment date can be delayed by up to two months after the ex-date.

For investors seeking a comprehensive list of stocks going ex-dividend in the near future, WallStreetNewsNetwork.com has compiled a downloadable list containing numerous dividend-paying companies. Here are a few examples showcasing the stock symbol, ex-dividend date, periodic dividend amount, and annual yield.

Costco Wholesale Corporation (COST)11/1/20241.160.52%
Citigroup, Inc. (C)11/4/20240.563.37%
Pfizer, Inc. (PFE)11/8/20240.425.82%
United Rentals, Inc. (URI)11/13/20241.630.79%
TJX Companies, Inc. (TJX)11/14/20240.3751.31%
Applied Materials, Inc. (AMAT)11/21/20240.400.84%
Moody’s Corporation (MCO)11/22/20240.850.74%
Dow Inc. (DOW)11/29/20240.705.59%

To access the entire list of over 100 ex-dividend stocks, subscribers will receive an email in the next couple days with the full list. If you are not already a subscriber, you can sign up using the provided signup box below. Don’t miss out on this valuable information, and the best part is that it’s free!

Dividend Definitions

To better understand the dividend-related terms, let’s define them:

Declaration date: This refers to the day when a company announces its intention to distribute a dividend in the future.
Ex-dividend date: On this day, if you purchase the stock, you would not be eligible to receive the upcoming dividend. It is also the first day on which a shareholder can sell their shares and still receive the dividend.
Record date: This marks the day when you must be recorded on the company’s books as a shareholder to qualify for the dividend. Typically, the ex-dividend date is set two business days prior to the record date.
Payment date: This is the day on which the dividend payment is actually made to the eligible shareholders. It’s important to note that the payment date can be as long as two months after the ex-date.

Before implementing the “Buying Dividends” technique, it is crucial to reconfirm the ex-dividend date with the respective company to ensure accuracy and avoid any unexpected changes.

In conclusion, being aware of the stocks going ex-dividend can be advantageous for traders and investors employing the “Buying Dividends” strategy. WallStreetNewsNetwork.com provides a convenient resource to access a comprehensive list of such stocks, allowing individuals to plan their investment decisions effectively. Remember to stay informed and consider market conditions before employing any investment strategy.

Disclosure: Author owns PFE.

Are Democrats or Republicans or Libertarians Better Investors?

by Fred Fuld III

Last year, I posted an article about the political ETFs, which track the investments of politicians based on the reporting of their transactions, which politicians are legally required to provide.

I mentioned in that article that year-to-date, Democrats were far outperforming the Republicans.

At the end of the year, I posted a followup article which showed that Democrats were still outperforming.

Let’s take a look at how these stocks are doing this year.

DJT

First of all, there is the Trump Media & Technology Group (DJT), which is a media and technology company founded by former U.S. President Donald Trump in 2021. DJT was established with the goal of creating an alternative to mainstream media and tech platforms, which Trump and his supporters claim limit conservative voices. The company’s flagship project is Truth Social, a social media platform that aims to provide a space for free speech and minimal content moderation.

In addition to Truth Social, DJT has announced plans for other ventures, such as a subscription-based video-on-demand service called TMTG+, which would feature a mix of entertainment, news, and documentary content catering to a conservative audience. The company has faced both praise and controversy, navigating legal and regulatory challenges while securing funding and building partnerships to expand its media footprint. The company aims to position itself as a significant player in the conservative media landscape and a counterbalance to established tech giants.

In regards to the return on the stock, it is up over 201% so far this year, as of the time this article is being written. The company’s a market cap of $10 billion, is debt free, and is currently generating negative earnings.

Congressional Investors

The Democrats, based on the return of the Unusual Whales Subversive Democratic Trading ETF (NANC), is up over 25.8% so far this year. The ETF invests in companies that sitting Democratic members of United States Congress and/or their families also have reported to have invested in. The expense ratio is 0.75%.

As for the Republicans, Unusual Whales Subversive Republican Trading ETF (KRUZ), trailing far behind, up only 14.85%. It invests in stocks that sitting Republican members of United States Congress and/or their families also have reported to have invested in. The expense ratio is 0.75%.

Political Contributions

There is also the Political Contribution Comparison, which shows the returns of companies that make political contributions to Democratic versus Republican candidates and political action committees.

This analysis shows the following returns.

The Democratic Large Cap Core ETF (DEMZ) invests in large cap companies that make political contributions to Democratic Party candidates and political action committees above a certain threshold. Total return so far for the year is 22.1%.

The Point Bridge America First ETF (MAGA) has a goal of investing in companies  that are highly supportive of Republican candidates. The return so for is just 16.8%.

Semi-Political EFTs

Also, there are the semi-political ETFs. These ETFs are somewhat different in that they leave the politicians out of the analysis, both as investors and political donees. These ETFs have very different returns.

The God Bless America ETF (YALL) is an ETF that screens out companies that support liberal political activism and social agendas. It was up an incredible 36.7% for the year. 

The American Conservative Values ETF (ACVF) invests in stocks that meet its politically conservative criteria. The annual return was a positive 23.1%.

One ETF that is considered by many to be a “liberal” ETF is the SPDR MSCI ACWI Climate Paris Aligned ETF (NZAC). It is for “investors seeking to implement net-zero strategies and address climate change in a holistic way”. The ETF is up 17.8% year-to-date.

Libertarians

A Libertarian play is the Global X MSCI Argentina ETF (ARGT) due to the fact that Argentina now has a libertarian president. This fund is up about 45% this year, far outpacing the S&P 500, which is up 22.4%. ARGT has a market cap of $394 million, a price to earnings ratio of 20.45, and even pays a dividend with a yield of 1.12%. The expense ratio is 0.59%.

Finally, there is the Freedom 100 Emerging Markets ETF (FRDM) which seeks to invest in countries with higher personal and economic freedom scores. The ETF is up 8.32% this year.

Most of the above have extremely low market caps of less than $200 million, and wide bid and asked spreads, with limited liquidity.

The next couple weeks should be interesting, not just for politics and the election, but for the political ETFs. So now, not only do you have many choices of presidential candidates, you also have many political ETF choices.

Disclosure: Author owns ARGT.

Should You Invest in Autographs?

by Fred Fuld III

Reading time: 3 minutes

Investing in autographs has grown in popularity as both a unique collectible and a potentially lucrative asset. From historic documents bearing the signatures of past leaders to sports memorabilia signed by legendary athletes, autographs can hold considerable sentimental and monetary value. However, like any investment, there are benefits and risks, and understanding the nuances of this market is crucial for anyone looking to make sound investments in autographs.

The primary benefit of investing in autographs is the potential for significant appreciation over time. Rare autographs, particularly those of iconic figures who have passed away, often become more valuable as they become scarcer and more sought after.

An autograph from Abraham Lincoln, for instance, has historically shown strong price appreciation due to its historical significance and rarity. Similarly, signed items from famous athletes, actors, and musicians, especially those who are no longer signing autographs, can command high prices and are in steady demand among collectors.

Autographs are also unique and, in many cases, evoke powerful connections to significant events or cultural moments, adding an emotional value that goes beyond their monetary worth.

For example, University Archives is auctioning off a collection of Washington to Obama Autographs: Full Presidential Set of Signatures as President, which has an estimate of $400,000 to $500,000. At the time this article was written, there have been 22 bids with the current bid at $245,000.

Alexander Historical Autographs recently offered a studio photograph of the election-determining first-ever televised presidential debate between Senator JOHN F. KENNEDY and Vice President RICHARD M. NIXON, inscribed and signed in the white bottom margin by both. It was priced at $26,000 and may have already been sold.

Boston Sportscard Exchange is auctioning a Babe Ruth, Lou Gehrig & Honus Wagner Signed 1920’s Baseball, with an estimate of $20,000 to $25,000.

However, the autograph market comes with considerable risks that should be carefully evaluated. One of the primary risks is authenticity. Forgeries are common, particularly for high-demand signatures from figures like Michael Jordan, Marilyn Monroe, or The Beatles. Even if an autograph comes with a certificate of authenticity, there is no absolute guarantee, as forgeries can be sophisticated.

This risk makes it essential for investors to work with reputable dealers and, when possible, to rely on respected third-party authentication services like PSA/DNA or Beckett. Market volatility is another risk factor, as the value of autographs can fluctuate based on trends, the current popularity of a celebrity, and broader economic conditions. For instance, a sports star’s signature might skyrocket if they win a major championship, only to decrease in value once the media attention fades.

In addition to these benefits and risks, potential investors should be mindful of the nuances of maintaining and storing autographs. Autographs can be delicate, and improper storage can lead to fading or other damage that diminishes their value.

It is recommended to keep autographs in controlled environments, ideally away from sunlight and in acid-free materials that will preserve ink and paper integrity over time.

Investors should also be aware that the type of item an autograph is on can affect its value. Signed baseball cards, for instance, are often more valuable than signed photos, and the medium matters: a signed photo might be worth more than a signed piece of paper, depending on the signature’s visibility and the item’s condition.

Investing in autographs requires a keen eye, diligence, and a willingness to invest in authentication and preservation. While the market can be highly rewarding, it is crucial to remain aware of the risks and to treat autographs as a niche investment.

For those willing to invest the time and effort, autographs can offer both a connection to historical and cultural icons and a tangible, potentially appreciating asset. However, only by navigating the market cautiously and relying on trustworthy sources can investors make the most of this unique collectible opportunity.

Busting 3 Common Myths About the Stock Market: Insights That Challenge the Status Quo

by Fred Fuld III

The stock market is often surrounded by myths that can intimidate potential investors or lead to misconceptions about how it works. Whether it’s seasoned traders or first-time investors, many still fall prey to outdated beliefs or misleading narratives. Today, we’re going to debunk three of the most common stock market myths and provide fresh perspectives on what really drives success in the markets.


Myth 1: Investing in Stocks is Just Like Gambling

The Reality: While both stock investing and gambling involve risk, the two are fundamentally different in terms of strategy and long-term outcomes.

The notion that investing in stocks is equivalent to gambling is rooted in the fact that both activities involve uncertain outcomes. However, gambling is typically a zero-sum game with fixed odds, where the house always has the advantage. In contrast, stock investing is a way to own part of a business, and the value of that business can grow over time as it generates revenue and profits.

Unique Insight: The stock market rewards informed decisions and long-term thinking. Rather than relying on chance, successful investors analyze businesses, industries, and market trends to make calculated investments. While there are short-term fluctuations, over the long term, the stock market tends to reflect the growth of the economy, offering opportunities for investors to grow their wealth as well.

Takeaway: Smart investing is about researching and understanding the companies you invest in, not simply “betting” on the next big thing.


Myth 2: You Need a Lot of Money to Start Investing

The Reality: In today’s digital age, investing is more accessible than ever, and you don’t need to be wealthy to start.

One of the biggest barriers for would-be investors is the belief that you need thousands of dollars to make meaningful investments. In the past, this might have been somewhat true due to high brokerage fees or minimum investment requirements. However, the landscape has shifted dramatically with the rise of low-cost brokers and fractional shares, allowing individuals to invest with just a few dollars.

Unique Insight: The real key to success isn’t how much money you start with but how consistently you invest and for how long. With compounding interest, even small, regular investments can grow substantially over time. Many online platforms now allow you to invest in fractional shares, meaning you can own a portion of expensive stocks like Amazon or Tesla without needing the full share price.

Takeaway: The power of investing lies in the habit of starting early and being consistent. You don’t need to be wealthy to build wealth.


Myth 3: The Stock Market is Too Volatile for Average Investors

The Reality: While short-term volatility exists, long-term investors typically outperform by riding out the ups and downs.

The fear of losing money during market downturns leads many people to believe that the stock market is too unstable for the average investor. This perception often comes from focusing too much on short-term price movements. It’s true—the market can experience sudden drops, but historically, it has always recovered and continued to grow over time.

Unique Insight: Market volatility is often overemphasized in the media, which can make it seem like investing is risky business. In reality, volatility is a normal part of the market cycle, and those who can stay calm and avoid selling in panic often come out ahead. What really drives long-term gains is time in the market, not trying to time the market. Holding a diversified portfolio of stocks over the long term has historically provided returns that outpace inflation and other investments like bonds or real estate.

Takeaway: Volatility is not your enemy. Long-term investors who stay the course usually benefit from the market’s overall upward trajectory.


Conclusion: Redefining Stock Market Success

Investing in the stock market doesn’t have to be a gamble, nor does it require a large sum of money or a high tolerance for risk. By dispelling these myths, we hope to show that the stock market is a tool that can be harnessed by everyday investors—those who take the time to learn, make informed decisions, and stay patient.

Remember, building wealth through the stock market is not about overnight success but rather about thoughtful and consistent long-term investments. So, get started today, even if it’s small, and let time work its magic on your portfolio!


What other stock market myths have you come across? Drop them in the comments below, and let’s continue to separate fact from fiction!

Investing in Silver and Silver Mining Stocks

by Fred Fuld III

Estimated Reading Time: 5 Minutes

Silver has long been regarded as a valuable commodity for investors seeking to diversify their portfolios, particularly during times of economic uncertainty. Often dubbed “poor man’s gold,” silver serves as both an industrial metal and a safe-haven asset, providing a unique blend of utility and stability. In addition to physical silver, many investors look to silver mining stocks as a way to gain exposure to the metal’s price movements, potentially amplifying returns. This article delves into the merits of silver as an investment, and profiles three prominent silver mining companies: First Majestic Silver, MAG Silver, and Silvercorp Metals.

The Investment Appeal of Silver

Silver offers a dual-purpose investment strategy. On one hand, it plays a critical role in various industrial applications, from electronics to solar panels and medical devices, which ensures a steady demand. On the other hand, silver is often seen as a store of value, much like gold, during times of inflation, currency devaluation, or global economic instability. This unique characteristic positions silver as a hedge against both market downturns and inflationary pressures.

If you are thinking of investing in silver coins, you should check out my previous article Unveiling the Precious Metal’s Potential in Your Portfolio, which covers how to tell if your coins are real or counterfeit.

Silver mining stocks, in particular, present an attractive investment option. These stocks are typically more volatile than the price of silver itself, meaning they can offer greater upside potential when silver prices rise. However, they can also carry higher risks, as they are subject to operational challenges, geopolitical risks, and fluctuating commodity prices. For investors with a higher risk tolerance, silver mining stocks can be an exciting way to gain leveraged exposure to the metal.

First Majestic Silver (AG)

First Majestic Silver Corp (NYSE: AG) is a Canadian company primarily focused on the production of silver in Mexico. It operates three producing silver mines: the San Dimas, La Encantada, and Santa Elena mines. First Majestic is known for being one of the few pure-play silver miners, with the majority of its revenue coming from silver production, making it particularly attractive to investors who want exposure to the metal.

The company’s focus on high-grade silver assets and its operational efficiency has helped it maintain competitive production costs, which is critical in a low-price environment. Moreover, First Majestic has shown a strong commitment to expanding its production capabilities through exploration and acquisition, positioning itself for future growth if silver prices rise.

First Majestic has a market capitalization of $2.21 billion, and trades at 40 times forward earnings. Earnings per share growth next year is anticipated to be up 259%. The company pays a dividend of 0.34%.

MAG Silver (MAG)

MAG Silver Corp (NYSE AMEX: MAG) is another Canadian silver-focused miner with a strong growth profile. Its flagship asset is the Juanicipio Project in Mexico, which it operates as a joint venture with Fresnillo Plc, the world’s largest primary silver producer. The Juanicipio mine is considered one of the highest-grade silver projects globally and is expected to be a major driver of production growth for MAG Silver in the coming years.

Although MAG Silver is not yet a significant producer, the potential output from Juanicipio offers substantial upside for investors seeking exposure to an emerging silver producer. The company’s low debt levels and robust project pipeline make it a solid option for those with a longer-term view on silver’s growth potential.

The stock, with a $1.74 billion market cap, has a trailing price to earnings ratio of 28.7 and a forward P/E of 20.4. Earnings per share growth next year is anticipated to be up 16.7%. The company does not pay a dividend.

Silvercorp Metals (SVM)

Silvercorp Metals Inc (NYSE AMEX: SVM) distinguishes itself from other silver miners by being the largest silver producer in China. The company operates multiple mines in the Ying Mining District, a historically significant silver-producing region. Silvercorp’s business model is built on high-margin operations, focusing on controlling costs while maintaining consistent production levels.

One key advantage for Silvercorp is its ability to generate profits even in a low silver price environment due to the by-product credits from its lead and zinc production, which helps offset operational costs. Silvercorp also has a solid balance sheet, making it an attractive option for investors looking for a relatively lower-risk play within the silver mining sector.

The stock has a $1.09 billion market cap, has a trailing price to earnings ratio of 18.5 and a forward P/E of 13.8. Earnings per share growth this year was up 76.5%, but expected to be flat next year. The company pays a dividend of 0.95%.

The Case for Silver Mining Stocks

Silver mining stocks offer an appealing combination of growth potential and leverage to the price of silver. Unlike physical silver, which simply tracks the metal’s price, mining stocks can benefit from operational efficiencies, exploration success, and production growth.

However, they also come with additional risks, including management performance, political stability in mining regions, and fluctuating production costs. For investors who believe in the long-term outlook for silver, investing in silver mining companies can provide outsized returns, particularly if silver prices rally.

In summary, silver remains an attractive option for investors looking to hedge against economic uncertainty and benefit from the metal’s industrial demand. Companies like First Majestic Silver, MAG Silver, and Silvercorp Metals provide a range of investment profiles, from established producers to emerging players with high-growth potential. As with any investment, conducting thorough due diligence is essential, but for those with a bullish view on silver, these stocks offer a promising opportunity to participate in the metal’s future price movements.

Disclosure: Author didn’t own any of the above at the time the article was written.

How to Invest in the Halloween Season

by Fred Fuld III

Halloween, celebrated on October 31st, has roots that stretch back thousands of years to ancient Celtic traditions. The holiday is believed to have originated with the festival of Samhain, a pagan celebration marking the end of the harvest season and the beginning of winter, or the “darker half” of the year. Samhain was a time when the Celts believed the veil between the world of the living and the dead was at its thinnest, allowing spirits to roam freely. To ward off malevolent spirits, the Celts would light bonfires and wear costumes made of animal heads and skins, blending into the supernatural atmosphere.

When Christianity spread across Celtic lands, the festival of Samhain gradually merged with Christian traditions. By the 9th century, the Catholic Church designated November 1st as All Saints’ Day, a time to honor saints and martyrs, and the night before became known as All Hallows’ Eve. Over time, this evolved into Halloween. As European immigrants brought these traditions to North America, they blended with Native American and other cultural influences, shaping the modern version of the holiday. Halloween in the U.S. became widely celebrated in the late 19th and early 20th centuries, growing into the festive night of costumes, trick-or-treating, and spooky decorations we know today.

Halloween will be here shortly, and will be a boon for the candy manufacturers. The motion picture companies that produce horror movie also benefit.

Hershey Foods (HSY): Founded in 1894 by Milton S. Hershey, Hershey Foods is one of the largest and most iconic chocolate manufacturers in the world. Headquartered in Hershey, Pennsylvania, the company is best known for its classic chocolate bars, Hershey’s Kisses, and Reese’s Peanut Butter Cups. Over the years, Hershey has expanded its portfolio to include a wide range of snacks, including popcorn and pretzels, and is a global player in the confectionery industry, operating in more than 60 countries. The company also places a strong emphasis on corporate social responsibility, particularly in sustainable cocoa farming.

The stock has a trailing price to earnings ratio of 20.5, a forward P/E ratio of 20, and  pays a dividend yield of 2.9%.

Tootsie Roll Industries (TR): Tootsie Roll Industries, founded in 1896, is a renowned American confectionery company famous for producing iconic treats like Tootsie Rolls, Tootsie Pops, Dots, and Junior Mints. Headquartered in Chicago, the company has a long legacy of producing nostalgic candy that remains popular across generations. Tootsie Roll Industries prides itself on a stable, family-run business model, with a focus on maintaining classic recipes and product consistency while innovating with new treats and flavors.

The stock has a P/E of 22.8 and pays a yield of 1.19%. Earnings per share this year jumped 20.7%.

Mondelez International (MDLZ): Mondelez International, founded in 2012 as a spin-off from Kraft Foods, is a multinational snack and confectionery giant. Headquartered in Chicago, the company owns a portfolio of globally recognized brands, including Oreo, Cadbury, Toblerone, and Trident. Mondelez operates in more than 150 countries, with a strong focus on the snack food market, particularly in the categories of biscuits, chocolate, gum, and candy. Sustainability and environmental responsibility are key pillars of the company’s strategy, with initiatives aimed at reducing packaging waste and sourcing sustainable ingredients like cocoa.

Its candy brands include Sour Patch, Swedish Fish, Cadbury, and Toblerone. The trailing P/E is 24.7 and the forward P/E is 20. The yield is a tasty 2.5%.

Watching horror movies is another popular event on Halloween.

Netflix (NFLX): Founded in 1997 as a DVD rental-by-mail service, Netflix has since evolved into the world’s leading streaming entertainment platform. Headquartered in Los Gatos, California, the company has revolutionized the way people consume media, with over 230 million subscribers globally. Netflix is known for its vast library of TV shows, films, and documentaries, and has become a dominant force in content creation, producing award-winning original series like Stranger ThingsThe Crown, and The Witcher. The company continues to innovate in the streaming space, expanding its international content and experimenting with interactive media.

This high flying stock has an extensive selection of scary movies in its collection of titles. The stock trades as 42.9 times trailing earnings and 32.3 times forward earnings. Earnings per share skyrocketed by 62.9% this year. It does not pay a dividend.

Lionsgate Studios (LION): The stock, commonly known as Lionsgate, is a Canadian-American entertainment company founded in 1997. Headquartered in Santa Monica, California, it is best known for producing and distributing films and television series across a wide range of genres. Lionsgate has gained significant recognition for successful franchises such as The Hunger GamesJohn Wick, and Saw, as well as its television arm, which includes popular shows like Orange is the New Black. With a focus on independent production and distribution, Lionsgate has established itself as a major player in both film and TV industries.

The company is a major producer of scary movies, which has made such films as American Psycho, Ginger Snaps, Route 666, The Devil’s Rejects, House of the Dead 2, Saw VI, See No Evil, Hostel: Part II, My Bloody Valentine 3D and many others. Lionsgate currently has generated negative earnings.

Then of course, Amazon (AMZN) has plenty of Halloween costumes. Amazon has a trailing PE of 45 and a forward PE of 32.

Hopefully, your Halloween stocks will bring you treats.

Disclosure: Author owns AMZN.