Top Tech Short Squeeze Stocks

by Fred Fuld III

Yesterday, the Dow Jones Industrial Average tanked by around 1200 points, the biggest drop since June 2020. The technology stocks were heavily hit.

This may create a buying opportunity for tech stocks that are heavily shorted.

Do short squeeze stocks actually go up?

On August 22, 2022, I posted an article about meme related short squeeze stocks, and pointed out Bed Bath and Beyond (BBBY) after it had its big run-up. In exactly one week after the article was posted, the stock jumped by more than 43%.

Another stock that was described was Intercept Pharmaceuticals, Inc. (ICPT), which increased by almost 5% in just two days.

The stock with the biggest short ratio (days to cover), at 14.3, was Heron Therapeutics, Inc. (HRTX). It rose by 9.5% in three days.

When you short a stock, it means that your goal is to make money from a drop in the price of a stock. Technically, what happens is that you borrow shares of a stock, sell those shares, then buy back those shares at a hopefully lower price so that those shares can be returned. This all happens electronically, so you don’t actually see all the borrowing and returning of shares; it just shows up on your screen as a negative number of shares.

Short sellers can be profitable, but sometimes when the stock moves against them, and begins to rise, the short sellers jump in right away to buy shares to cover their positions, creating what is called a short squeeze. When a short squeeze takes place, it can cause the share prices to increase fast and furiously. Any good news can trigger the short squeeze.

Some traders utilize this situation by looking for stocks to buy that may have a potential short squeeze. Here is what a short squeeze trader should take into consideration:

Short Percentage of Float ~ The float is the number of freely tradable shares and the short percentage is the number of shares held short divided by the float. Amounts over 10% to 20% are considered high and potential short squeeze plays.

Short Ratio / Days to Cover / Short Interest Ratio -This is probably the most important metric when looking for short squeeze trades, no matter what you call it. This is the number of days it would take the short sellers to cover their position based on the average daily volume of shares traded. This is a significant ratio as it shows how “stuck” the short sellers are when they want to buy in their shares without driving up the price too much. Unfortunately for the shortsellers, the longer the number of days to cover, the bigger and longer the squeeze.

Short Percentage Increase ~ This is the percentage increase in in the number of short sellers from the previous month.

The following are some heavily shorted tech stock that may be worth considering.

CompanySymbolShort % of FloatShort % ChangeShort Interest Ratio
Asana, Inc.ASAN20.59%15%4.3
Avaya Holdings Corp.AVYA33.68%57%1.5
Ebix, Inc.EBIX24.67%-1%11.2
iRobot CorporationIRBT25.60%10%7

The first stock on the list, Asana (ASAN), a San Francisco based work management software company, has over 20% of its float shorted, an increase of 15% over last month. This is considered a daily substantial amount.

The short interest ratio is 4.3, which means that it would take the short sellers more that four days to cover their position, based on recent average volume.

The Massachusetts based robot maker iRobot (IRBT) is even more heavily shorted with in excess of 25% of the float shorted. It will take seven days for the short sellers to cover their positions.

Just keep in mind that just because a stock has good earnings ratios and is heavily shorted, doesn’t mean that the stock will go up, especially in a bear market. Also, stocks that are significantly shorted may be shorted for a reason.

Disclosure: Author didn’t own any of the above at the time the article was written.

MAGA is the New FAANG

Do you remember what the FAANG stocks are, or were? MAGA is the New FAANG.

by Fred Fuld III

Do you remember what the FAANG stocks are, or were?

Facebook (FB) (META), Amazon (AMZN), Apple (AAPL), Netflix (NFLX), and Google (GOOG) (GOOGL).

Jim Cramer created the FANG acronym back in 2013 for Facebook, Amazon, Netflix, and Google, because he said that these tech stocks were “totally dominant in their markets“.

However, in 2017, he added Apple due to its growth, adding an extra A to the acronym, changing it to FAANG.

Yet, several changes have taken place since then. First, Facebook has changed its name to Meta,along with its symbol, so the letter M has to be used in the acronym.

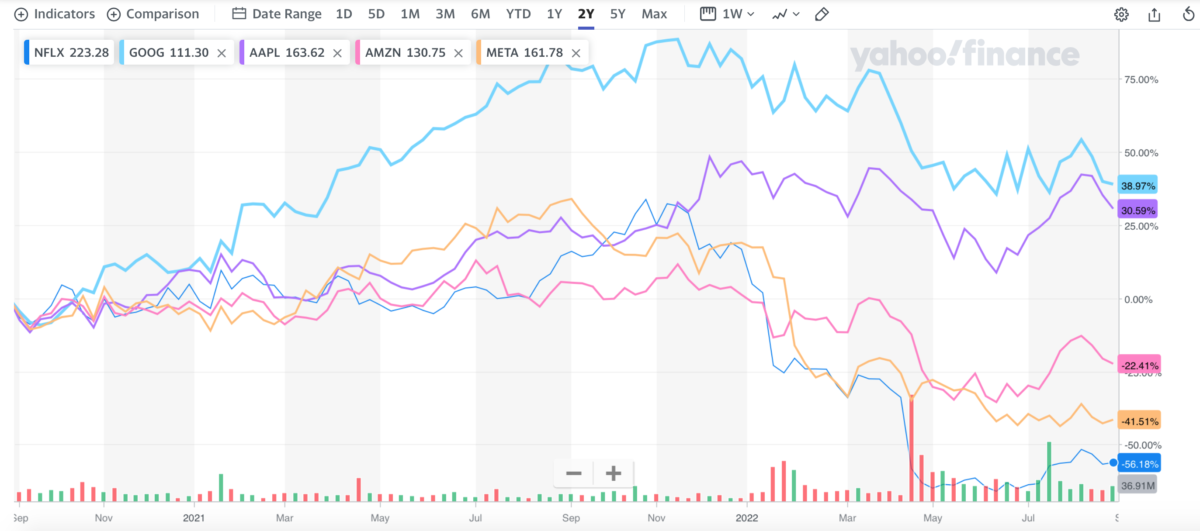
Second, Netflix is not really a tech stock. It is actually considered an entertainment company in the communications services sector. Plus, many investors no longer consider it a growth stock if you look at the return over the last few years.

Just in the last twelve months, Netflix has dropped over 61%. If you had bought the stock at the beginning of 2018 and held it, you would have barely broken even. If you had bought in in 2019, 2020, or 2021, and held it, you would have a good size loss.

Finally, even though Google changed its name to Alphabet, nobody calls it that, and the company is still keeping the same stock ticker symbols beginning with the letter G.

So that gives us Meta, Amazon, Google, and Apple as the leading tech stocks.

Or to abbreviate it, MAGA.

Now that should be easy to remember.

Disclosure: Author owns MSFT, AAPL and AMZN.

MORE POPULAR STOCK LISTS OF INTEREST

Top 10 Short Squeeze Plays

Stocks Going Ex Dividend

Business Development Companies Paying Over 10%

Bed Bath & Beyond $BBBY CFO Fell to his Death: Sources

The Chief Financial Officer of Bed Bath & Beyond (BBBY) jumped to his death from the Jenga Building in Tribeca in New Yor City, according to sources.

Gustavo Arnal was the CFO and executive vice president of the company.

The tragedy happened on Friday.

He sold over 40,000 shares of the company stock last month, raising over $1 million.

Bed Bath & Beyond had become a meme stock with the price exceeding $28 a share back in August.

The stock closed at 8.63 on Friday, and ended up at 8.59 in after-market trading.

Warren Buffett’s Favorite High Yield Stocks All Paying Over 3%

Warren Buffett is the most famous investor in the world. Check out his high yield stocks.

by Fred Fuld III

Warren Buffett, the CEO of Berkshire Hathaway (BRKA) (BRKB), is the most well known investor in the world.

He is also not only one of the wealthiest investors, he is also the seventh wealthiest person in the world, according to Forbes, sporting a net worth of $96.7 billion.

In addition, Buffett is a very interesting character.

Many investors like to follow in Buffett’s footsteps in terms of investments, in order to match his outstanding returns.

Yet, some of Buffett’s stocks don’t pay dividends, such as Amazon (AMZN), and if you are an income investor, you might want to choose the top dividend paying stocks of Berkshire Hathaway.

At the top of the list is Kraft Heinz (KHC), which pays a dividend of $1.60 per year and currency has a very favorable yield of 4.28%. The stock trades at 13.5 times forward earnings and even sells at a discount to book value with a Price to Book ratio of 0.94.

In second place is U. S. Bancorp (USB), which pays a high yield of 4.01%, with a $1.84 dividend rate. The stock has a very reasonable forward price to earnings ratio of 8.91%.

Next is Chevron (CVX) yields 3.60%, paying out $5.68 per year, payable quarterly. The forward P/E ratio is a solid 9.37.

HP Inc. (HPQ) is another one of Buffett’s holdings paying over 3%, with a yield of 3.55%. The stock trades at an extremely low 6.43 times forward earnings.

Finally, Bank of New York Mellon (BK) has a yield of 3.44%. The forward P/E is a solid 8.66. This is another Berkshire company that sells below book value with a price/book ratio of 0.92.

Maybe some of Buffett’s dividend paying stocks can help make you rich.

MORE POPULAR STOCK LISTS OF INTEREST

Top 10 Short Squeeze Plays

Stocks Going Ex Dividend

Business Development Companies Paying Over 10%

Top Debt Free Stocks Selling Below Cash per Share

Stocks selling below cash per share with no debt

by Fred Fuld III

With the stock market tanking during the last couple weeks, there are currently over 250 stocks that not only sell below book value but also sell below cash per share. Plus, many of these companies have little or no debt.

Selling below cash means that if the corporation were to go out of business immediately, assuming the inventory, real estate, machinery, and other assets were totally worthless, there would still be enough cash in the bank to distribute to all shareholders at an amount higher than the current stock price.

One example is Wheels Up Experience (UP), a private aviation services company. This debt free company, with a market cap of $470 million, is trading 87% of its cash per share and 69% of its book value.

Earnings per share growth is expected to be over 30% next year. The price sales ratio for Wheels Up is an extremely superb 0.31.

Back in June, Goldman Sachs initiated coverage on the stock with a Buy recommendation. Wheels Up trades on the NYSE.

Another example is ContextLogic (WISH), which trades on NASDAQ. This ecommerce platform company has a market cap close to $1 billion. The stock price is trading at 97% of the cash per share, and the company has no debt.

The price sales ratio is a favorable 0.97 and earnings per share growth this year is 54.8%.

Here is a list of debt free and low debt stocks, selling below cash per share.

CompanySymbolMarket Cap
Wheels Up Experience Inc.UP470.27M
Atea Pharmaceuticals, Inc.AVIR650.02M
Bright Health Group, Inc.BHG1.03B
ContextLogic Inc.WISH919.01M
Ideanomics, Inc.IDEX304.08M

Keep in mind that these stocks are selling at a low price and have very low market caps for a reason, and are extremely speculative.

No recommendations are expressed or implied. Do your own due diligence.

Disclosure: Author didn’t own any of the above at the time the article was written.

MORE STOCK LISTS OF INTEREST

Top 10 Short Squeeze Plays

Stocks Going Ex Dividend

Business Development Companies Paying Over 10%

Incredible $12.6 Million for a 1952 Mickey Mantle Baseball Card

by Fred Fuld III

Did you ever think that maybe you should put a little of your investment portfolio into sports cards?

After hearing about the latest Heritage Auctions result, you might want to consider it. However, make sure you go for the rare items.

A 1952 Mickey Mantle baseball card was hammered at an amazing $12.6 million, setting a world record.

This 1952 Topps Mickey Mantle #311 SGC Mint+ 9.5 card was described as “Finest Known Example!”.

In addition, Heritage announced that there will be a documentary made about the card called  “Four Perfect Corners” by Emmy-Award winning director Dan Klein.

Mickey Mantle:

• Second highest career OPS+ among center fielders

• Highest stolen-base percentage in history at the time of his retirement

• Lowest career rate of grounding into double plays

• Highest World Series on-base percentage and World Series slugging percentage

• .984 fielding percentage when playing center field

• Hit 536 career home runs

• Batted .300 or more ten times

• Only player in history to hit 150 home runs from both sides of the plate.

• 16th all-time in home runs per at-bats

• 17th in on-base percentage

• MVP award three times, finished second three times, and finished within nine votes of winning five times.

When investing in collectables, make sure you stick with the scarce and rare items, and the items that you are personally interested in.

Don’t forget to check out the related articles:

The $5 Million Michael Jordan Jersey

$677,196 for Steve Jobs Apple 1 Computer

Princess Diana’s Car to be Auctioned

Top 10 Short Squeeze Plays: Will One of Them Become a Meme Stock?

by Fred Fuld III

There is a way that traders and investors can make money on the long side from short squeezes. One strategy that stock traders use is buying short squeeze stocks, companies have been heavily shorted. Here is a more extensive explanation of short squeeze stocks.

When you short a stock, it means that your goal is to make money from a drop in the price of a stock. Technically, what happens is that you borrow shares of a stock, sell those shares, then buy back those shares at a hopefully lower price so that those shares can be returned. This all happens electronically, so you don’t actually see all the borrowing and returning of shares; it just shows up on your screen as a negative number of shares.

Short sellers can be profitable, but sometimes when the stock moves against them, and begins to rise, the short sellers jump in right away to buy shares to cover their positions, creating what is called a short squeeze. When a short squeeze takes place, it can cause the share prices to increase fast and furiously. Any good news can trigger the short squeeze.

Some traders utilize this situation by looking for stocks to buy that may have a potential short squeeze. Here is what a short squeeze trader should take into consideration:

Short Percentage of Float ~ The float is the number of freely tradable shares and the short percentage is the number of shares held short divided by the float. Amounts over 10% to 20% are considered high and potential short squeeze plays.

Short Ratio / Days to Cover / Short Interest Ratio -This is probably the most important metric when looking for short squeeze trades, no matter what you call it. This is the number of days it would take the short sellers to cover their position based on the average daily volume of shares traded. This is a significant ratio as it shows how “stuck” the short sellers are when they want to buy in their shares without driving up the price too much. Unfortunately for the shortsellers, the longer the number of days to cover, the bigger and longer the squeeze.

Short Percentage Increase ~ This is the percentage increase in in the number of short sellers from the previous month.

So what stocks are heavily shorted that may be worth a closer examination? Check out the following list, but be aware, that have reasons for shorting these stocks.

CompanySymbolExchangeShort InterestShort % ChangeShort RatioFloat
Bed Bath & Beyond Inc.BBBYNasdaq47.22%2%2.361.56M
Intercept Pharmaceuticals IncICPTNasdaq45.12%4%12.623.63M
Heron Therapeutics IncHRTXNasdaq39.56%1%14.3102.22M
SpringWorks Therapeutics IncSWTXNasdaq38.77%3%9.431.64M
Big Lots, Inc.BIGNYSE37.66%1%6.626.49M
MicroStrategy IncMSTRNasdaq36.51%-7%3.29.32M
Upstart Holdings IncUPSTNasdaq35.73%0%2.472.32M
Big 5 Sporting Goods CorpBGFVNasdaq35.28%2%10.220.85M
Beyond Meat IncBYNDNasdaq35.12%-7%5.556.79M
Evgo IncEVGONasdaq34.98%-2%8.367.74M
Fubotv IncFUBONYSE32.96%10%4.2166.36M

Let’s take a look at two of these stocks and compare them.

Bed Bath & Beyond (BBBY) has been in the news extensively over the last couple weeks, going from 9 to 30 and back down to 9 again. You will notice that it is at the top of the short list. However, notice the Short Ratio, which is also the Days to Cover Ratio, of only 2.3.

This means that it would take the short sellers only a couple days to cover their position, based on current average volume. Plus there has only been a 2% increase in the short positions versus last month.

Now look at number two on the list, Intercept Pharmaceuticals (ICPT), which has a very high short ratio of 12.6, meaning that it would take almost thirteen days for the short sellers to cover. In addition, the percentage increase in short positions went up by 4%.

Just keep in mind that just because a stock has good earnings ratios and is heavily shorted, doesn’t mean that the stock won’t continue to drop, especially in a bear market. Also, stocks that are significantly shorted may be shorted for a reason.

Disclosure: Author didn’t own any of the above at the time the article was written.

Top Stocks Going Ex Dividend in September 2022

The following is a short list of some of the many stocks going ex dividend during the next month.

The following is a short list of some of the many stocks going ex dividend during the next month.

Many traders and investors use the stock trading technique called ‘Buying Dividends,’ also commonly referred to as ‘Dividend Capture.’ This is the strategy of buying stocks before the ex dividend date and selling the stock shortly after the ex date at about the same price, yet still being entitled to the dividend.

This technique generally works in bull markets and flat or choppy markets, but during bear markets, you may want to consider avoiding this strategy. In order to be entitled to the dividend, you have to buy the stock before the ex-dividend date, and you can’t sell the stock until on or after the ex date.

The actual dividend may not be paid for another few weeks. WallStreetNewsNetwork.com has compiled a downloadable list of the stocks going ex dividend in the near future. The list contains many dividend paying companies, lots with market caps over $500 million. Some of the stocks have yields over 2%. Here are a few examples showing the stock symbol, the ex-dividend date, the periodic dividend amount, and the annual yield.

Dominion Energy, Inc. (D)9/1/20220.6683.12%
Nike, Inc. (NKE)9/2/20220.3051.08%
H&R Block, Inc. (HRB)9/7/20220.292.43%
Kimberly-Clark Corporation (KMB)9/8/20221.163.39%
HP Inc. (HPQ)9/13/20220.252.92%
Coca-Cola Company (KO)9/15/20220.442.70%
Restaurant Brands International (QSR)9/20/20220.543.65%
ConocoPhillips (COP)9/29/20221.401.83%
Republic Services, Inc. (RSG)9/30/20220.4951.35%

The entire list of over 200 ex-dividend stocks will be emailed to all subscribers early next week, on Tuesday, August 25, 2022. If you are not a subscriber, you can sign up at the signup box below. Don’t miss out. Remember, it’s free!

Dividend Definitions

Declaration date: the day that the company declares that there is going to be an upcoming dividend.

Ex-dividend date: the day on which if you buy the stock, you would not be entitled to that particular dividend; or the first day on which a shareholder can sell the shares and still be entitled to the dividend.

Record date: the day when you must be on the company’s books as a shareholder to receive the dividend. The ex-dividend date is normally set for stocks at two business days before the record date.

Payment date: the day on which the dividend payment is actually made, which can be as long at two months after the ex date.

Don’t forget to reconfirm the ex-dividend date with the company before implementing this technique.

Disclosure: Author did not own any of the above at the time the article was written; affiliate links are on this page.

Stocks That Made New Highs on Friday

By Fred Fuld III

Yesterday, Friday, August 19, 2022, in spite of the stock market being down, there were several stocks that actually made new highs.

Many stock traders believe that when a stock makes a new high, it is bullish for the stock.

Plus if a stock makes new highs on a day when the stock market drops, then that is very positive for the stock and extremely bullish.

So yesterday, the S&P 500 was down 55, the Dow Jones Industrial Average was down 292, and the NASDAQ was down an incredible 260, which was a drop of more than 2%.

In spite of that, there were a select few companies that did rise on Friday.

The following is a group of the new high stocks, most of which are biotech companies.

Axsome Therapeutics (AXSM)

NL Industries (NL)

ADMA Biologics (ADMA)

Intercept Pharmaceuticals (ICPT)

Supernus Pharmaceuticals (SUPN)

Artesian Resources (ARTNA)

Keep in mind that some of these stock are very low cap and therefore very speculative.

Check out the related articles of interest

10 BDC Stocks Paying Over 8%

4 Equity REITs Paying High Yields Over 10%

DisclosureL Author didn’t own any of the above at the time the article was written.
Would You Pay $5 Million for Michael Jordan’s Jersey?

We made you aware of the auction of Princess Diana’s car, and Steve Jobs autograph on a floppy disk.

Credit: Courtesy of Sotheby’s

Now is your chance to get something in the sports field.

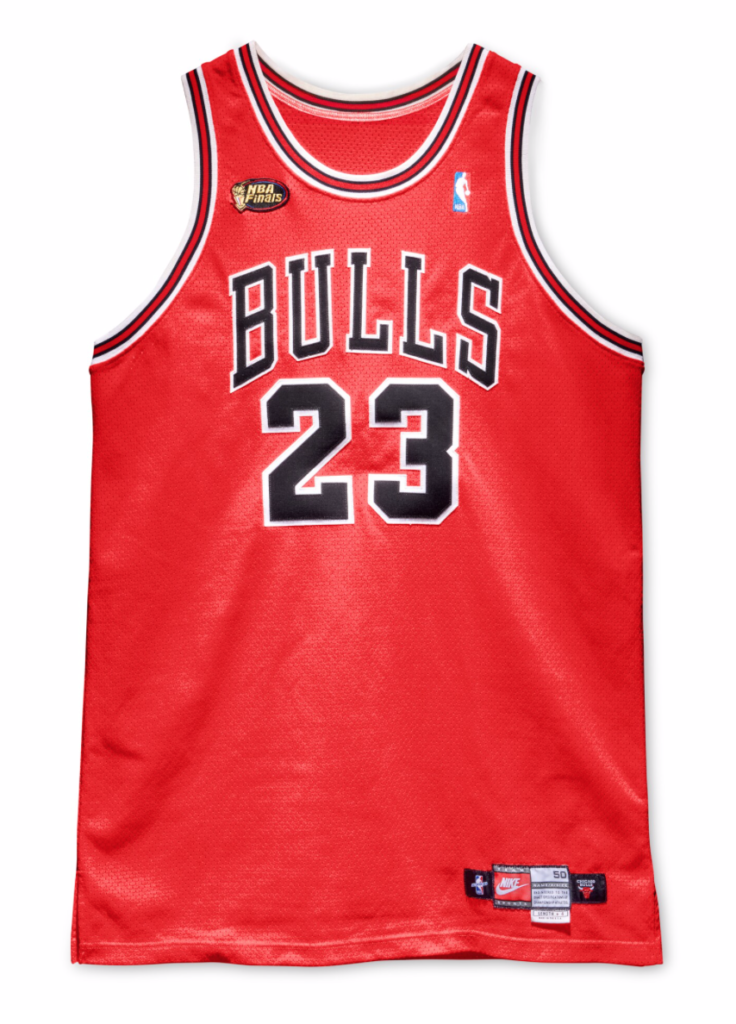
The auction house Sotheby’s will be offering the jersey from Michael Jordan from his final NBA championship.

He wore this Chicago Buls jersey during the game with the Utah Jazz.

The auction will be held during September 6 to the 14th as a single lot sale.

It is expected to be hammered at $3 million to $5 million.