Looking for reading material during the holidays? Looking for a great gift for your investor friends?
by Fred Fuld III
Looking for reading material during the holidays? Looking for a great gift for your investor friends? Look no further than these investment and stock market related books, all of which came out in the last twelve months.
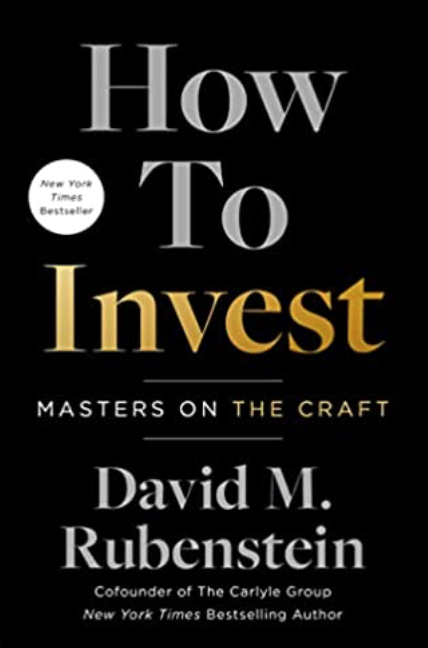
How to Invest: Masters of the Craft by David M. Rubenstein, co-founder of the Carlyle Group, was just released a couple months ago. It is a great compilation of interviews and conversations the author has had with famous investors, such as Ron Baron, John Rogers, Seth Klarman, Ray Dalio, Marc Andreeson, and many others. It doesn’t just cover the stock market; it also includes real estate, fixed income, SPACs, venture capital, and private equity.
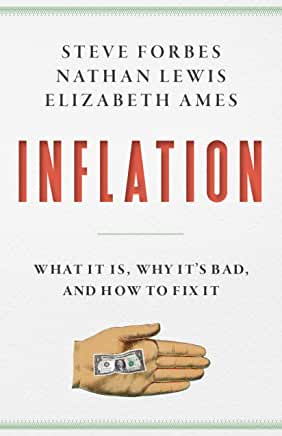
Inflation: What It Is, Why It’s Bad, and How to Fix It by Steve Forbes, Nathan Lewis, and Elizabeth Ames was published in April of this year. It covers the history of inflation, why it i bad for society as a whole, what happens if we get hyperinflation, and what can be done to prevent it.
In case you missed the news, the state of Colorado legalized psilocybin, psilocin, and the magic mushrooms that contain those hallucinogenic drugs.
In addition, the personal use of other psychedelics such as DMT, ibogaine and mescaline was also legalized.
Now other states are considering legalization.
I actually predicted psilocybin and hallucinogenic drugs as a growth industry just three years ago, in my presentation at the San Francisco Money show.
If you are looking for stocks that participating in this industry, there are a few, all of which trade on NASDAQ.
Compass Pathways (CMPS), which has a $468 million market cap, is developing COMP360, a psilocybin therapy for the treatment of treatment-resistant depression, and the treatment of post-traumatic stress disorder. This UK company is debt free, and has $4.47 in cash per share. It is currently generating negative earnings.
Cybin Inc. (CYBN) has a market cap of $76 million. This Toronto based company develops psilocybin based products to treat major depressive and alcohol use disorders. This is a debt free company that has 27 cents per share in cash. Earnings per share growth rate next year is estimated to be 16%.
Mind Medicine Inc. (MNMD), also known as MindMed, is a New York based company that is developing products to treat brain health disorders using LSD and Ibogaine. The market cap is $101 million.
Atai Life Sciences (ATAI) is a German based company that has a market cap of $475 million. The company has been developing pharmaceutical utilizing ibogaine and ketamine.
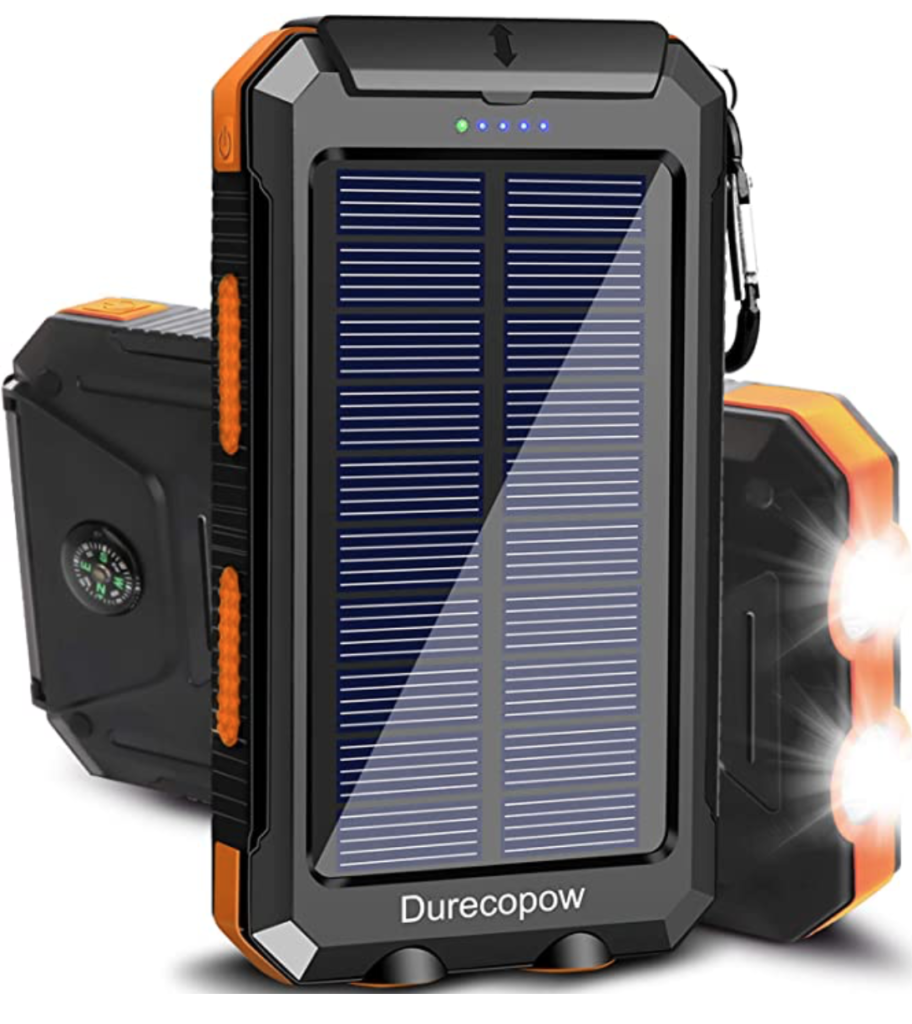
This is a great little multifunctional tool that has all kinds of features built in, including a Wrench, Screwdriver, Pen, Glass Breaker, Flashlight, and Bottle Opener. High quality, lightweight, and made with aluminum, it can fit in your pocket.
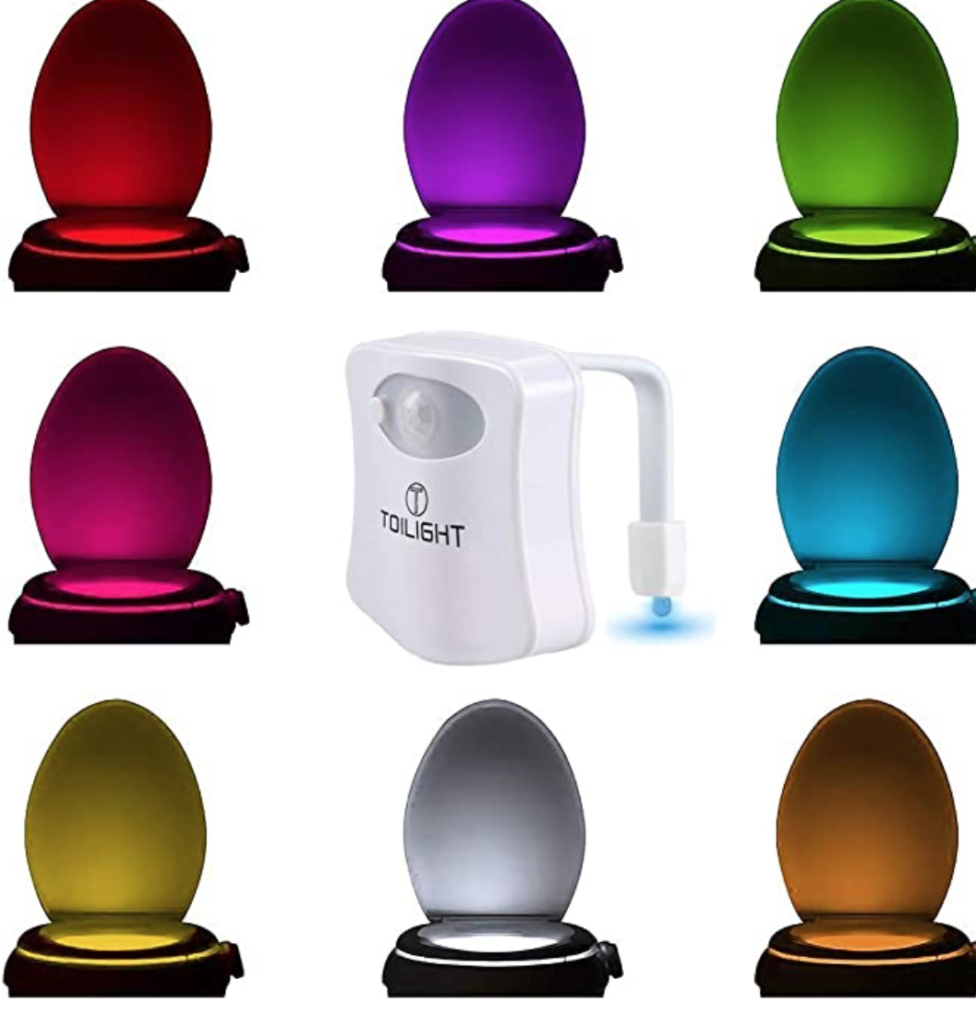
A better way of going to the bathroom, instead of turing on a bright light or peeing in the dark. ToiLight is a cool led motion activated night light which activates automatically when you approach the toilet bowl.
Happy shopping!!!
If you make a purchase through one of our partners’ affiliate links, we may receive compensation—at no extra cost to you.
This is an extensive guide which covers all aspects of selling; everything from how to get “The Edge”, to the sweet spot to prospect, to the characteristics of high performers.
My favorite chapter is “How to Use LinkedIn for Business Development,” where the author uses the analogy of “Six Degrees of Kevin Bacon.” Many tips and best practices are also included.
The book has charts and summaries throughout along with bonus tips and a checklist at the end.
FTX is a cryptocurrency exchange that just declared bankruptcy. It was founded in 2019 and based in the Bahamas. The company filed for bankruptcy today, November 11, 2022, due to a collapse in the price of the company’s exchange token FTT and a run on FTX.
How Did FTX Begin?
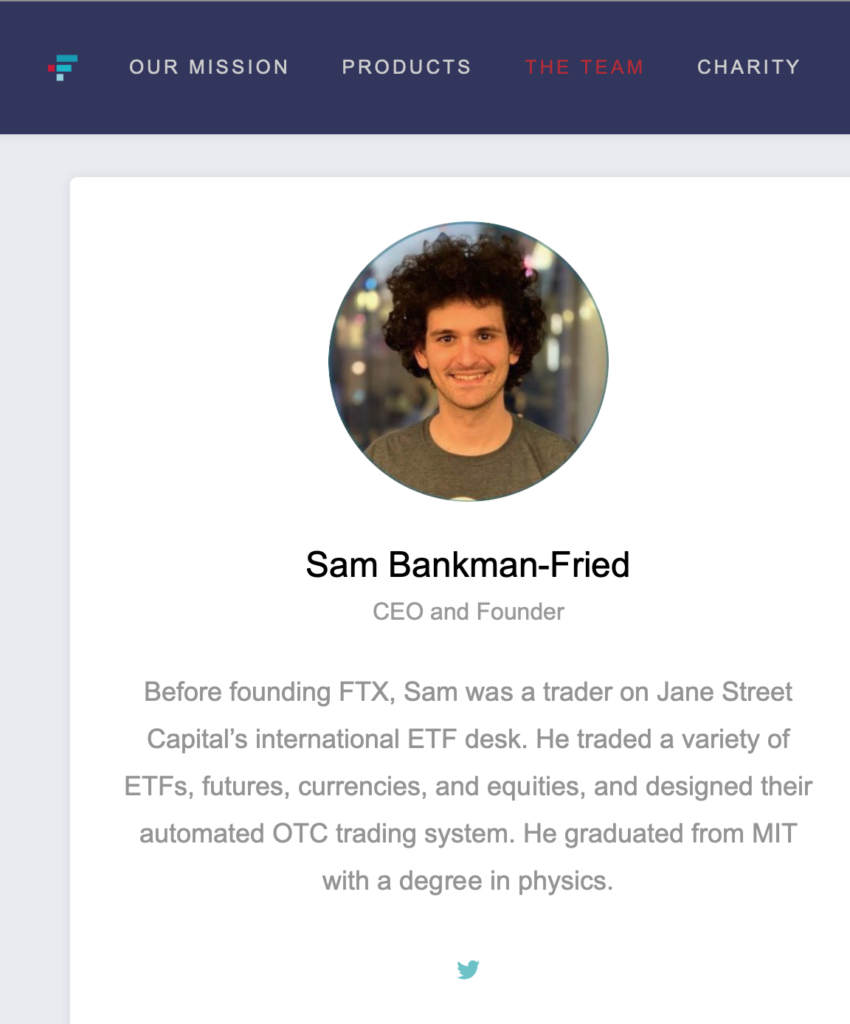
FTX was founded in 2019 by Sam Bankman-Fried and Gary Wang. Bankman-Fried started a quantitative trading firm Alameda Research. Bankman-Fried formerly worked as an ETF trader for the proprietary trading firm, Jane Street Capital.
source: about.ftx.us
FTX Investigations
In August 2022, the Federal Deposit Insurance Corporation (FDIC) issued a cease-and-desist letter to FTX accusing the company of making “false and misleading representations” about FDIC insurance due to a tweet by FTX president at the time, Brett Harrison. He later resigned on September 27, 2022
Two months later, Texas regulators investigated the company for allegedly selling unregistered securities.
FTX Collapse
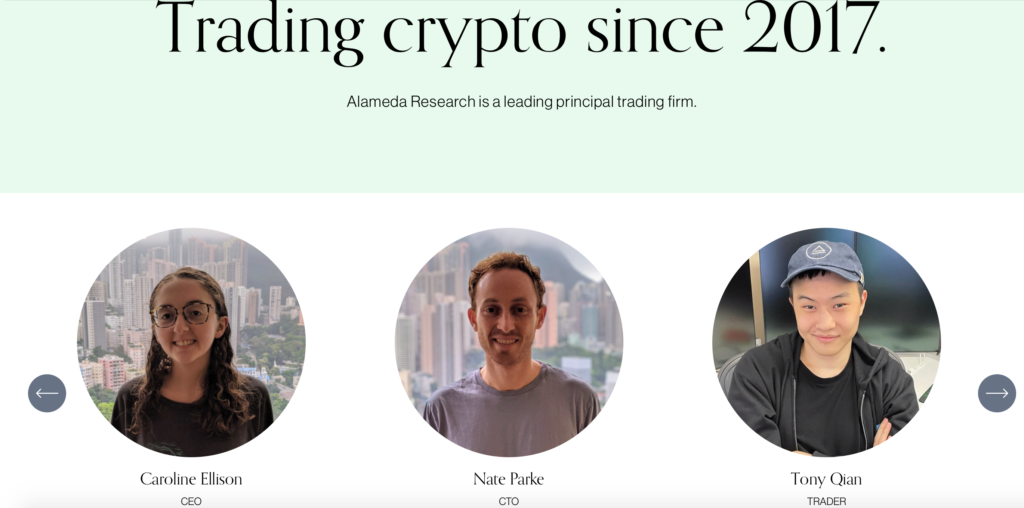
CoinDesk published an article on November 2, 2022, describing how a large portion of Alameda Research’s assets were held in FTT.
Source: archive.org: alameda-research.com
On November 7, Binance CEO Changpeng Zhao posted on Twitter that his company planned to sell all its holdings of FTT.
This obviously impacted FTT’s price and affected the prices of other cryptocurrencies.
This led to a bank run lasting three days of approximately $6 billion.
The next day, Zhao announced Binance had agreed to a non-binding agreement to purchase FTX, but did not include the sale of FTX.US, a separate exchange for United States citizens.
On November 9, Binance decided that it would not go ahead with the deal to acquire FTX, due to FTX’s reported mishandling of customer funds and pending investigations.
On the same day, FTX’s website said that withdrawals would not be processed at that time
Bankman-Fried stated that FTX.US was “not currently impacted” by the crisis
Venture capital firms that had invested in the company include Tiger Global Management and SoftBank Group.
According to a November 10 article in the Wall Street Journal, Alameda Research owed FTX some $10 billion, as FTX had lent out funds on the exchange for trading to Alameda so that Alameda could make investments.
FTX, FTX US, and Alameda filed for bankruptcy in Delaware on November11, and Bankman-Fried resigned as CEO.
Sponsorships
FTX has the naming rights to the Miami Heat’s basketball stadium, renaming it FTX Arena, plus naming for other sporting events.
Don’t wait until the last minute to do your holiday shopping. Now is a great time to get a gift for your relatives and friends who like to invest or trade stocks.
The following may give you some great ideas to give as presents.
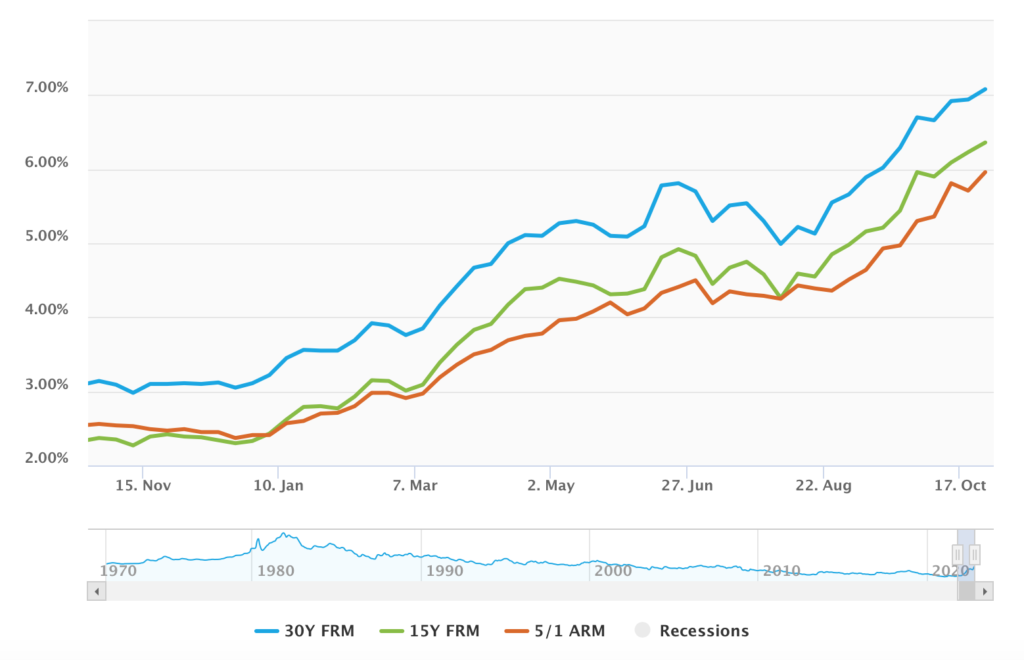
Just a year ago, 30-year fixed mortgages for homes were less than 3%, according to Fannie Mae. Now, the average mortgage rate is in excess of 7% for the same type of loan.
by Fred Fuld III
Just a year ago, 30-year fixed mortgages for homes were less than 3%, according to Fannie Mae. Now, the average mortgage rate is in excess of 7% for the same type of loan.
Source: Freddie Mac
An increase like that, where the annual cost to own has more than doubled, has to affect the price of real estate.
New buyers of homes will be affected.
Existing homeowners with variable rates will be affected.
Potential buyers of commercial properties will also be affected.
When the cost to own goes up, the price of the asset has to drop in value, assuming all other details remain equal.
So suppose you want to make money from the drop in real estate but you don’t want to (or unable to) short stocks or ETFs.
What’s a trader or investor to do?
There are a few Inverse Real Estate Exchange Traded Funds, which increase as the stocks in the portfolio drop in value.
The ProShares Short Real Estate ETF (REK) has net assets of $72.8 million and has an expense ratio of 0.95%. It is up 30.2% so far this year.
If you want to get a bigger bang for your buck, there is the ProShares UltraShort Real Estate ETF (SRS), which has a goal, in very simple terms, of providing twice the inverse return of a portfolio of REITs and real estate stocks. It has $85.2 million in net assets with a 0.95% expense ratio. This ETF is up 61.5% so far this year.
The Direxion Daily Real Estate Bear 3X Shares (DRV) is what is referred to as a triple bearish ETF, the most volatile and speculative. It has $197.85 million in assets, a 0.99% expense ratio, and has a year-to-date return of 88.5%.
Hopefully you can find some way to make money from the real estate market, and congratulations to those with fixed mortgages below 4%.
Disclosure: Author didn’t own any of the above at the time the article was written.
It’s Halloween today, a boon for the candy manufacturers. The companies that produce horror movie also benefit. It’s hard to believe it’s that time of year. Pretty soon it will be Thanksgiving.
The biggest beneficiaries of the Halloween season are the candy makers.
Hershey Foods (HSY), one of the biggest chocolate and candy companies in the world, with two of its most popular products being Hershey Kisses and Hershey Bars, along with Reese’s. The stock has a trailing price to earnings ratio of 33.5, a forward P/E ratio of 27, and pays a dividend yield of 1.7%. Next year’s annual earnings per share are anticipated to be up 8.36%.
Tootsie Roll Industries (TR) has an assortment of candy kids, such as Tootsie Rolls, Tootsie Roll Pops, Caramel Apple Pops, Charms, Blow-Pops, Blue Razz, Zip-A-Dee Pops, Cella’s, Mason Dots, Mason Crows, Junior Mint, Sugar Daddys, and Sugar Babies. The stock has a P/E of 40.5 and pays a yield of 0.89%. Earnings per share this year were up 12.5%.
Mondelez International (MDLZ) is a multinational producer of candy, along with food and beverages. Its brands include Sour Patch, Swedish Fish, Cadbury, and Toblerone. The trailing P/E is 22 and the forward P/E is 20. The yield is a tasty 2.5%.
Watching scary movies is another popular event on Halloween. Netflix (NFLX), the huge provider of videos in the US, has an extensive selection of scary movies in its collection of titles. The stock trades as 27.9 times trailing earnings and 28.1 times forward earnings. It does not pay a dividend.
A major producer of scary movies is Lions Gate Entertainment (LGF-A), which has made such films as American Psycho, Ginger Snaps, Route 666, The Devil’s Rejects, House of the Dead 2, Saw VI, See No Evil, Hostel: Part II, My Bloody Valentine 3D and many others. Lionsgate currently has generated negative earnings but has a forward price to earnings ratio of 227.
Then of course, Amazon (AMZN) has plenty of Halloween costumes. Amazon has a trailing PE of 93 and a forward PE of 56.
Hopefully, your Halloween portfolio will bring you treats.
Disclosure: Author didn’t own any of the above at the time the article was written.
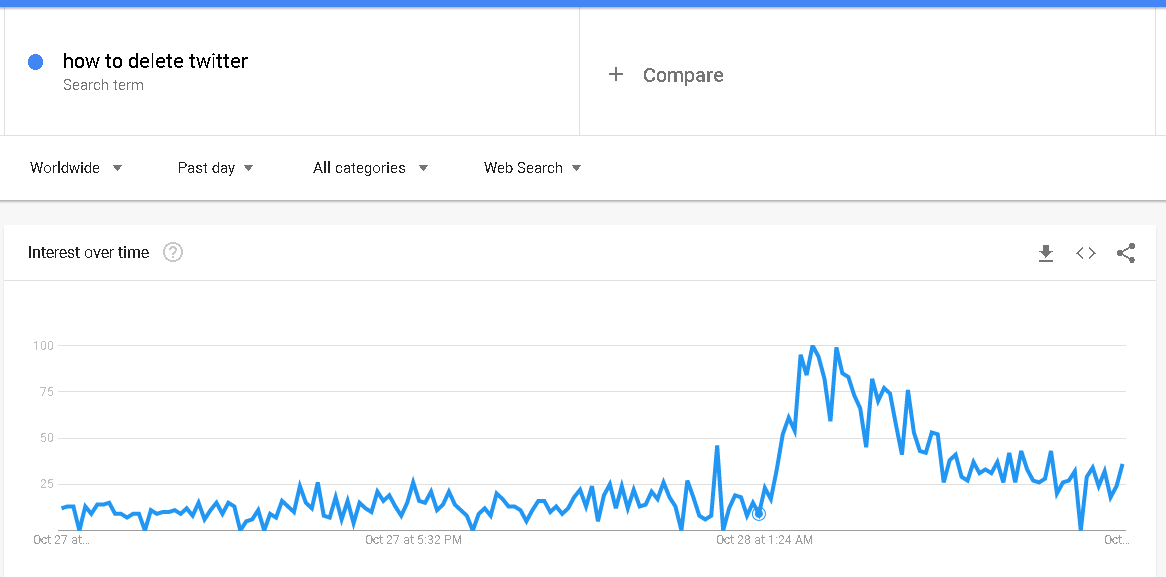
Online searches for “How to Delete Twitter” up 1011% in past 24 hours
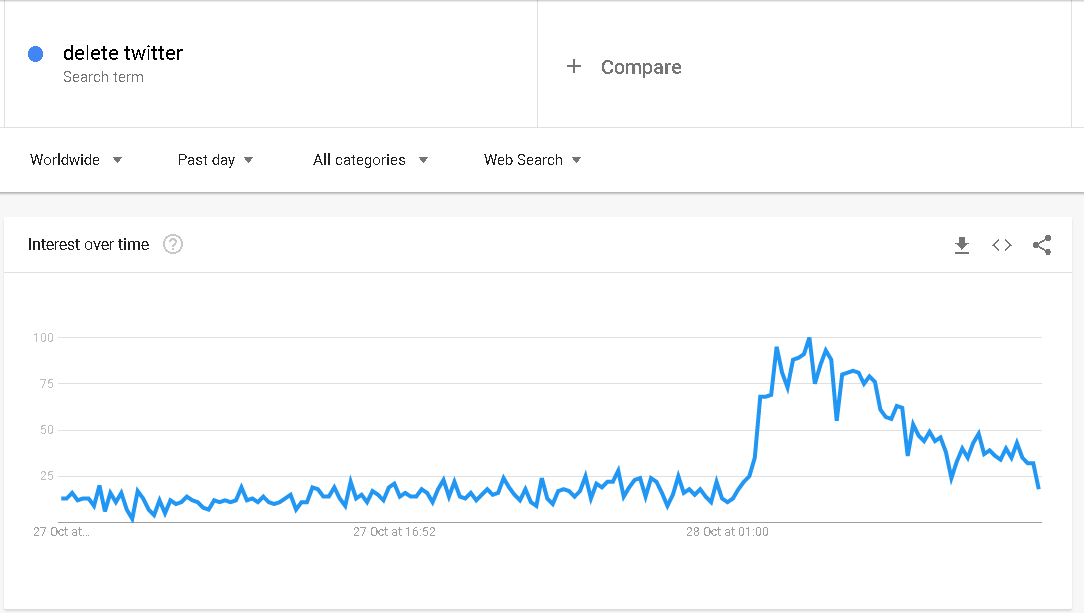
“Delete Twitter” searches up 560%
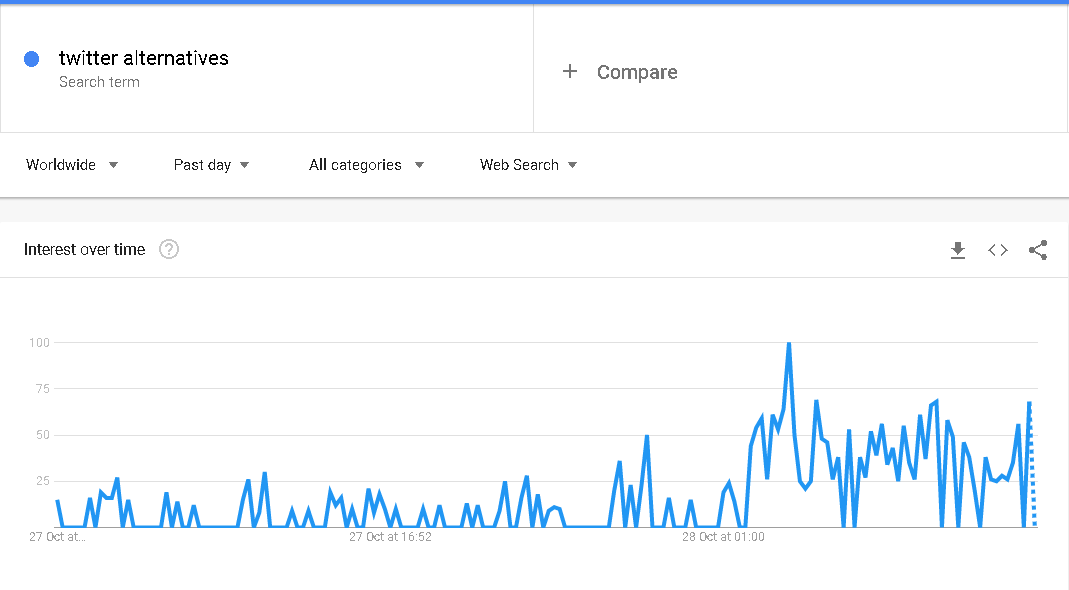
“Twitter Alternatives” searches up 300%
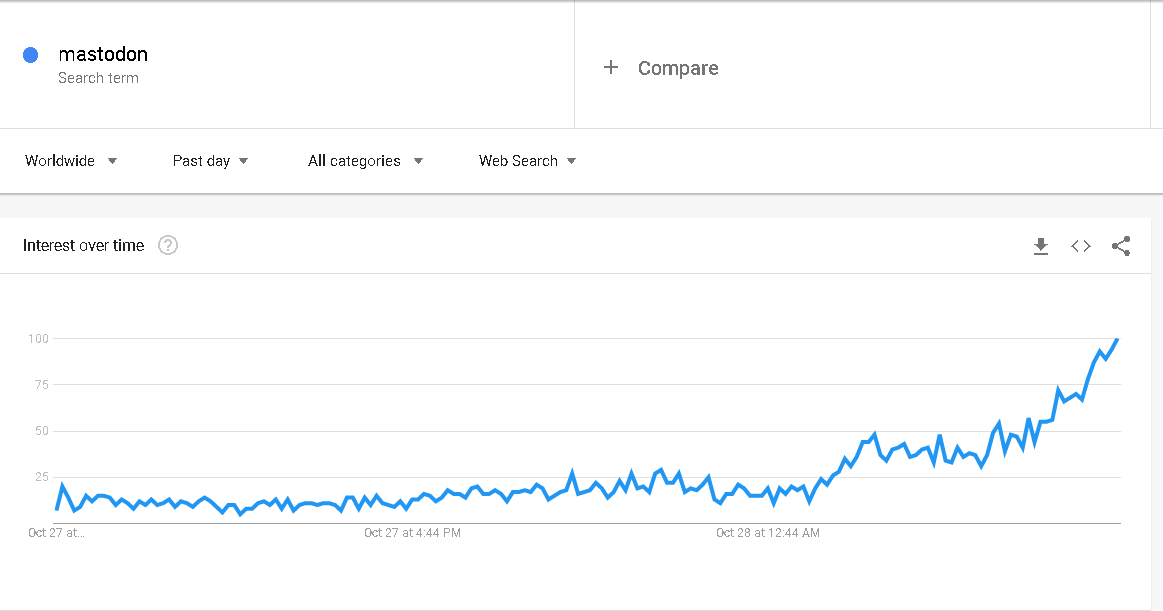
“Mastodon” one of Twitters main competitors, has seen searches jump 455.5%
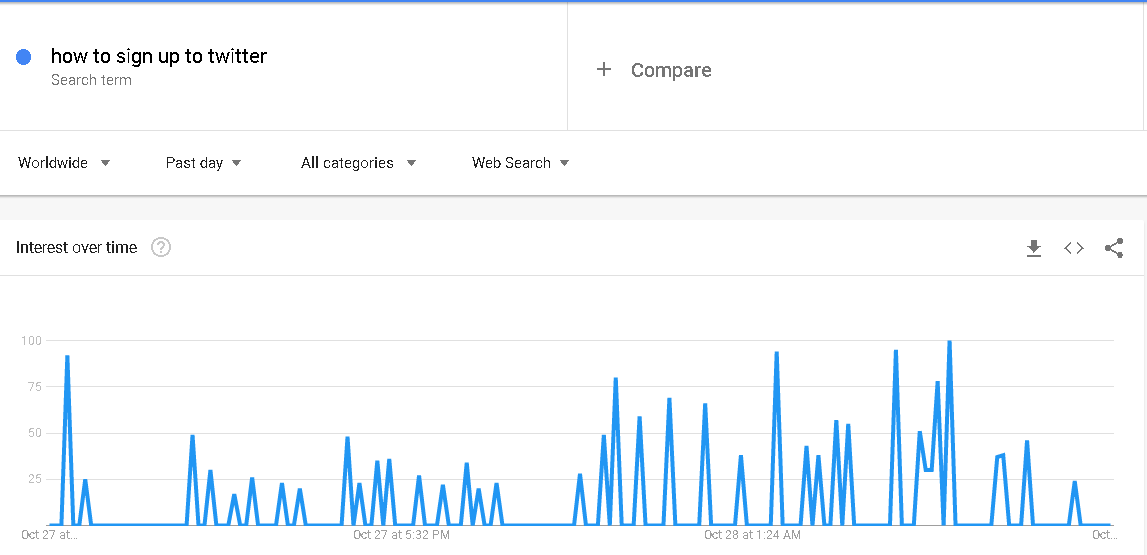
However, “How to Sign up to Twitter” searches are up 147.3%
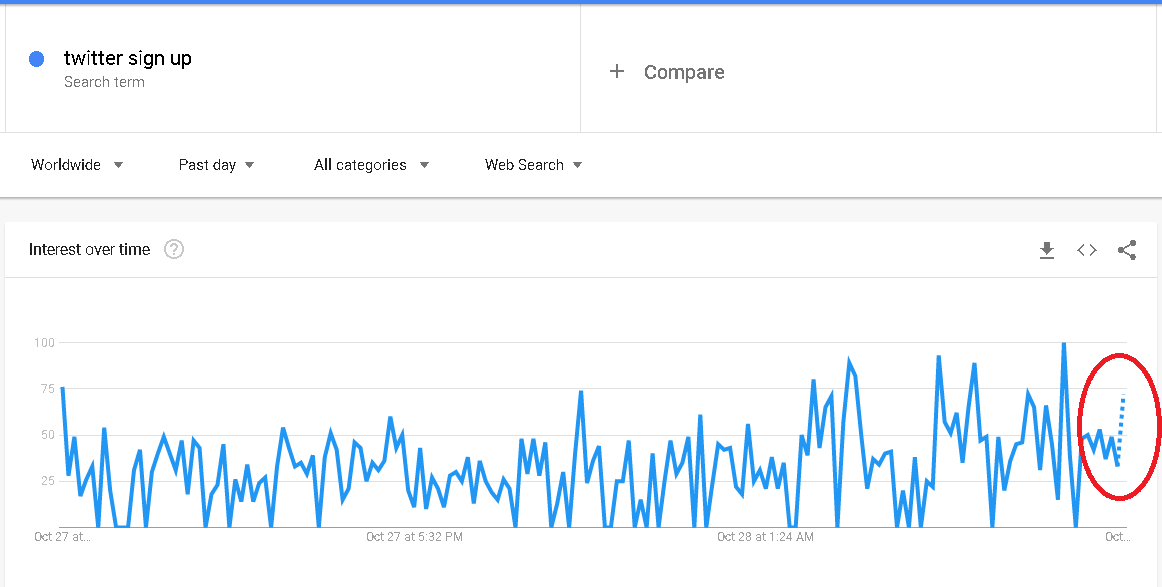
“Twitter Sign Up” also up 50%, but is sharply increasing in past few hours
Data in full below, hope this is of use to you! Any questions feel free to get in touch.
—————
“How to Delete Twitter” searches up 1011% since Elon Musk takeover announcement
Elon Musk’s Twitter takeover is now complete, but what does it mean for the social media giant?
The 51 year old business magnate has promised to ring the changes, but it seems Twitters current user base isn’t happy.
Searches for “How to Delete Twitter” have increased 1011% in the past 24 hours, while searches for “Delete Twitter” have also jumped 560%
Could this be an opportunity for some competitors to gain an advantage? The Data certainly suggests so, with searches for “Twitter Alternatives” up 300%.
Searches for micro-blogging service “Mastodon”, which has a distinctly Twitter-like feel, have jumped 455.5% also
It’s not a complete exodus however, since Musk closed the deal searches for “How to Sign up to Twitter” have increased 147.3%. There has been a small spike in searches for “Twitter Sign Up” also, with a 50% boost, however data shows a sharp increase in searches in the past 2 hours alone, so watch this space.
——
**Data gathered over the past 24 hours, up to 9am GMT**
Since the beginning of this year, the S&P 500 has dropped by over 20%. Many stocks are approaching bargain levels and some of them are heavily shorted, creating possible short squeeze opportunities.
Why should you care?
What happens when stocks get squeezed?
On August 22, 2022, I posted an article about meme related short squeeze stocks, and pointed out how Bed Bath and Beyond (BBBY) spiked by more than 43% in exactly one week after the article was posted.
Another stock that was described was Intercept Pharmaceuticals, Inc. (ICPT), which increased by almost 5% in just two days.
The stock with the biggest short ratio (days to cover), at 14.3, was Heron Therapeutics, Inc. (HRTX). It rose by 9.5% in three days.
So what are the latest short squeeze candidates? Keep reading.
What Does Shorting Stocks Mean?
When you short a stock, it means that your goal is to make money from a drop in the price of a stock. Technically, what happens is that you borrow shares of a stock, sell those shares, then buy back those shares at a hopefully lower price so that those shares can be returned. This all happens electronically, so you don’t actually see all the borrowing and returning of shares; it just shows up on your screen as a negative number of shares.
What is a Short Squeeze?
Short sellers can be profitable, but sometimes when the stock moves against them, and begins to rise, the short sellers jump in right away to buy shares to cover their positions, creating what is called a short squeeze. When a short squeeze takes place, it can cause the share prices to increase fast and furiously. Any good news can trigger the short squeeze.
Some traders utilize this situation by looking for stocks to buy that may have a potential short squeeze. Here is what a short squeeze trader should take into consideration:
Short Percentage of Float ~ The float is the number of freely tradable shares and the short percentage is the number of shares held short divided by the float. Amounts over 10% to 20% are considered high and potential short squeeze plays.
Short Ratio / Days to Cover / Short Interest Ratio -This is probably the most important metric when looking for short squeeze trades, no matter what you call it. This is the number of days it would take the short sellers to cover their position based on the average daily volume of shares traded. This is a significant ratio as it shows how “stuck” the short sellers are when they want to buy in their shares without driving up the price too much. Unfortunately for the shortsellers, the longer the number of days to cover, the bigger and longer the squeeze.
Short Percentage Increase ~ This is the percentage increase in in the number of short sellers from the previous month.
The following are some heavily shorted tech stock that may be worth considering.
Company
Symbol
Short % of Float
Short % Change
Short Interest Ratio
EVgo, Inc.
EVGO
31%
-1%
8.4
Rocket Companies, Inc.
RKT
33%
7%
10.3
Revolve Group, Inc.
RVLV
31%
0%
7.8
Switch, Inc.
SWCH
31%
16%
9.1
Upstart Holdings, Inc.
UPST
38%
0%
3.4
The second stock on the list, Rocket (RKT), which has a price to earnings ratio of 4.16, has 33% of its float shorted, an increase of 7% over last month, a daily substantial amount.
The short interest ratio is 10.3, which means that it would take the short sellers more that ten days to cover their position, based on recent average volume.
Just keep in mind that just because a stock has good earnings ratios and is heavily shorted, doesn’t mean that the stock will go up, especially in a bear market. Also, stocks that are significantly shorted may be shorted for a reason.
Disclosure: Author didn’t own any of the above at the time the article was written.