Top Carbon Capture Stocks

by Fred Fuld III

Did you know that there is a company near Reykjavik, Iceland, that has a facility can capture 4,000 metric tons of carbon dioxide every year?

The company is Climeworks, founded in May of 2017. The company’s plant captures carbon out of the air, then water is mixed with the carbon dioxide, pumped into the earth, and it turns to rock. Unfortunately for investors, it is privately held so you can’t invest in it yet.

However, there are several publicly traded stocks involved in the business of capturing carbon.

Carbon Capture Pure Plays

Aker Carbon Capture ASA (AKCCF) is a pure play in the carbon capture industry. This Norway based company provides carbon capture products, technology, and solutions. The stock has a $1.348 billion market capitalization. It is currently generating negative earnings. The company was founded in 2020.

Delta CleanTech Inc. (DCTIF) is a Calgary, Alberta, Canada based company that was one of the first involved in capturing carbon. The stock has a $6.388 million market capitalization and is currently generating negative earnings. The company was also founded in 2020.

Big Companies Participating in Carbon Capture in a Small Way

There are several large companies operating in the energy field that have divisions involved in carbon capture. They include Equinor (EQNR), NRG Energy (NRG), Shell (SHEL), Chevron (CVX), Occidental Petroleum (OXY), and Schlumberger (SLB).

Carbon Capture ETFs

If you want more diversification in the area of carbon capture stocks, you might want to consider carbon capture Exchange Traded Funds. There are a few to choose from:

  • KraneShares Global Carbon (KRBN)
  • ArcLight Clean Transition Corp. II (ACTD)
  • VanEck Vectors Low Carbon Energy ETF (SMOG)
  • iShares MSCI ACWI Low Carbon Target ETF (CRBN)

Hopefully you can clean up with one of these carbon capture companies.

Disclosure: Author didn’t;t own any of the above at the time the article was written.

Items Hit the Worst by Inflation

by Fred Fuld III

I’m sure you have noticed prices increasing, not just at the pump. But do you know what items have had the biggest price increases?

The following is a list of items with the biggest price increases according the the U.S. Bureau of Labor Statistics. These are the ones with a price boost of greater than 20%. year-over-year.

Fuel oil 43.6%
Gasoline, unleaded regular 38.7%
Gasoline, unleaded midgrade 35.6%
Gasoline, unleaded premium 33.3%
Other motor fuels 40.5%
Utility (piped) gas service 23.8%
Used cars and trucks 41.2%
Lodging away from home 25.1%
Other lodging away including hotels and motels 29%
Car and truck rental 24.3%
Admission to sporting events 20.9%
Private transportation 22.1%
New and used motor vehicles 23.5%

You will notice that average prices of used cars and trucks is up an incredible 41.2%. Admission to sporting events was up “only” 20.9%.

Hang on. These increases are only the beginning.

By the way, the picture shown with this article is way out of date. It is from four months ago. Prices in California are much higher now.

Top Inflation Hedge Gold Mining Stocks

by Fred Fuld III

It was just back in September when I wrote the article Top Gold Mining Stocks, almost six months to the day. In the article, I listed seven gold mining companies. The following shows the returns for those stocks.

Stock Symbol 9/13/22 3/10/22 Gain/Loss
AngloGold Ashanti Limited AU 15.5 25.73 66%
Caledonia Mining Corporation Plc CMCL 12.36 13.49 9%
DRDGOLD Limited DRD 9.15 10.14 11%
Gold Fields Limited GFI 8.64 16.69 93%
Harmony Gold Mining Company HMY 3.28 5.41 65%
Kinross Gold Corporation KGC 5.75 5.66 -2%
Sibanye Stillwater Limited SBSW 13.61 18.32 35%
AVERAGE 40%

As you can see, there was only one loser in the bunch, Kinross Gold (KGC) which was down 2%. However, all the others were up substantially. One, Gold Fields (GFT), almost doubled. The overall average return was 40%; not too shabby for a six month period.

Gold an Inflation Hedge & Recession Hedge?

Some studies have shown that gold may not track inflation during short time frames, but over long periods of time, gold has been considered an inflation hedge and a hedge against a downturn in the economy.

According to the U.S. Bureau of Labor Statistics, “gold prices can act as an indicator of the health of the economy. A rise in the price of gold may be a signal that the economy is struggling. As a result, in times of either a crisis or inflation, many investors turn to gold to protect their principal. By contrast, in times of economic stability, investors are more likely to turn to more speculative investments, such as stocks, bonds, and real estate. During these times, the price for gold often declines.”

(What is surprising about this statement is that stocks, bonds, and real estate are considered “speculative investments”. Does that make gold a “safe investment”?)

Top Gold Mining Stocks

So now that gold has started to move up, and recently broke the $2000 an ounce price barrier, what gold mining stocks have solid ratios now.

There are currently four gold mining companies that have trailing price to earnings ratios of less than 25, forward price to earnings ratios of less than 25, and yields above 2%. You will notice that only one stock from the old list, Agnico, made the cut for the new list.

Agnico Eagle Mines Limited (AEM)

Agnico Eagle is a Canadian based mining company with mines in Canada, Sweden, and Finland. The stock has a trailing P/E ratio of 23.3, a forward P/E ratio of 24.33, and pays a yield of 2.28%. Annual earnings per share growth for the last five years is 79%.

AngloGold Ashanti Limited (AU)

AngloGold, based in Johannesburg, South Africa, has mines in Africa, North America, South America, and Australia. The stock trades at 16.9 times trailing earnings and 12 times forward earnings. The dividend payout rate is 2.11%. Annual earnings per share growth for the last five years is 97%.

B2Gold Corp. (BTG)

The Canada based company, B2Gold, has three operating mines in Mali, the Philippines, and Namibia. The stock has a very favorable P/E ratio of 10.7 and forward P/E of 10.4. Even the price to earnings growth ratio is a commendable 0.53. Annual earnings per share growth for the last five years is 33%.

Sibanye Stillwater Limited (SBSW)

Sibanye is a South African company that has mines in South Africa, the United States, Zimbabwe, Canada, and Argentina. The stock has an excellent price to earnings ratio of 6.2, with a forward P/E of 12.2. Annual earnings per share growth for the last five years is 41%.

Maybe one of these mining stocks can provide your portfolio with a pot of gold.

Disclosure: Author owns BTG

Stocks Going Ex Dividend in March 2022

The following is a short list of some of the many stocks going ex dividend during the next month.

Many traders and investors use the stock trading technique called ‘Buying Dividends,’ also commonly referred to as ‘Dividend Capture.’ This is the strategy of buying stocks before the ex dividend date and selling the stock shortly after the ex date at about the same price, yet still being entitled to the dividend.

This technique generally works in bull markets and flat or choppy markets, but you need to avoid the strategy during bear markets. In order to be entitled to the dividend, you have to buy the stock before the ex-dividend date, and you can’t sell the stock until after the ex date.

The actual dividend may not be paid for another few weeks. WallStreetNewsNetwork.com has compiled a downloadable and sortable list of the stocks going ex dividend in the near future. The list contains many dividend paying companies, lots with market caps over $500 million, and some with yields over 2%. Here are a few examples showing the stock symbol, the ex-dividend date, the periodic dividend amount.

Company / Symbol Ex Dividend Date Periodic Amt. Yield
Dominion Energy, Inc. (D) 3/3/2022 0.668 3.36%
Nike, Inc. (NKE) 3/4/2022 0.305 0.85%
Wendy’s Company (WEN) 3/4/2022 0.125 2.20%
H&R Block, Inc. (HRB) 3/7/2022 0.27 4.35%
HP Inc. (HPQ) 3/8/2022 0.25 2.91%
Home Depot, Inc. (HD) 3/9/2022 1.90 2.41%
The Kraft Heinz Company (KHC) 3/10/2022 0.40 4.14%
Macy’s Inc (M) 3/14/2022 0.157 2.43%
Canadian Pacific Railway Limited (CP) 3/24/2022 0.149 0.85%
Portland General Electric (POR) 3/24/2022 0.43 3.43%
ConocoPhillips (COP) 3/30/2022 0.30 1.50%
Xerox Holdings Corporation (XRX) 3/30/2022 0.25 5.07%

The additional ex-dividend stocks can be found HERE . (If you have been to the page before, and the latest link doesn’t show up, you may have to empty your cache.) If you like dividend stocks, you should check out some of the other high yield stock lists at WSTNN.com HERE .

Dividend definitions:

Declaration date: the day that the company declares that there is going to be an upcoming dividend.

Ex-dividend date: the day on which if you buy the stock, you would not be entitled to that particular dividend; or the first day on which a shareholder can sell the shares and still be entitled to the dividend.

Record date: the day when you must be on the company’s books as a shareholder to receive the dividend. The ex-dividend date is normally set for stocks at two business days before the record date.

Payment date: the day on which the dividend payment is actually made, which can be as long at two months after the ex date.

Don’t forget to reconfirm the ex-dividend date with the company before implementing this technique.

Disclosure: Author did not own any of the above at the time the article was written; affiliate links are on this page.

How To Earn 7% US Government Guaranteed (No, It’s Not Forever Stamps, It’s a Real Bond)

by Fred Fuld III

How would you like to own the following investment:

  • It currently pays 7.12%
  • It is backed by the United States Government
  • It has an inflation factor
  • There is no commission
  • You can own it either electronically or in paper form
  • The interest is exempt from state and local income taxes
  • Interest earnings may be excluded from Federal income tax when used to finance education
  • The investment never drops in price
  • There is no minimum investment (well almost no minimum, you can invest less than $100)

So what kind of investment is this? No, it is not Forever Stamps. Sound too good to be true? It is called the Series I Savings Bond.

Here are the details.

What is an I Bond?

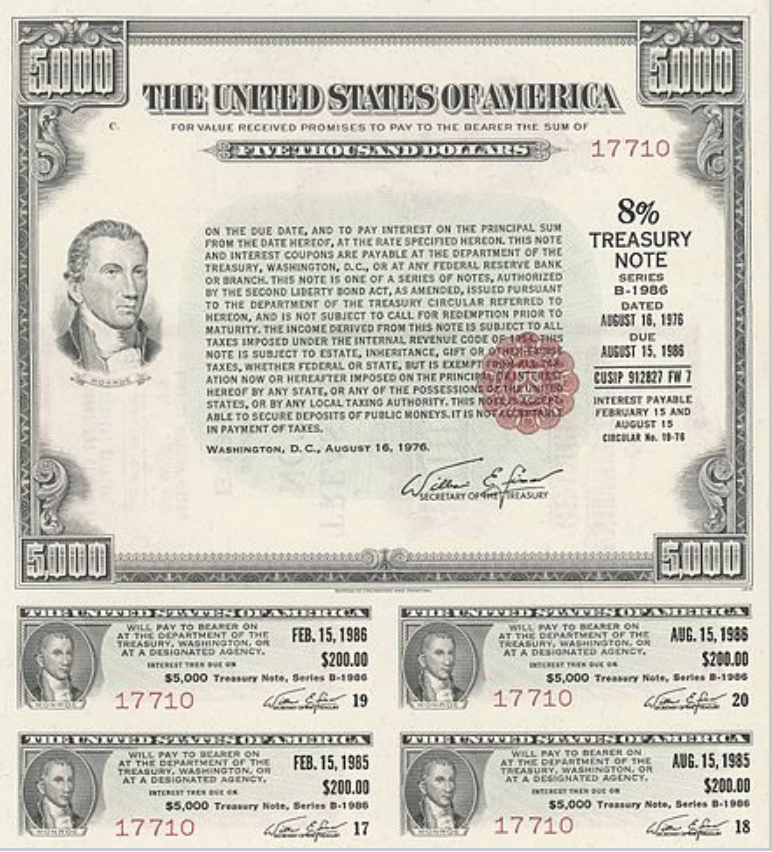
A Series I savings bond is a security issued by the United States Government that earns interest based on both a fixed rate and a rate that is set twice a year based on inflation. The bond earns interest until it reaches 30 years or you cash it, whichever comes first.

What’s the interest rate on an I Bond I buy today?

For the first six months you own it, the Series I bond sold from November 2021 through April 2022 earns interest at an annual rate of 7.12%. A new rate will be set every six months based on this bond’s fixed rate (0.00 percent) and on inflation.

Who may own an I Bond?

Individuals Yes, if you have a Social Security Number and meet any one of these three conditions:

  • United States citizen, whether you live in the U.S. or abroad
  • United States resident
  • Civilian employee of the United States, no matter where you live

To buy and own an electronic I bond, you must first establish a TreasuryDirect account.

Children under 18 Yes, if they meet one of the conditions above for individuals.
Information concerning electronic and paper bonds:

  • Electronic bonds in TreasuryDirect. A child may not open a TreasuryDirect account, buy securities in TreasuryDirect, or conduct other transactions in TreasuryDirect. A parent or other adult custodian may open for the child a TreasuryDirect account that is linked to the adult’s TreasuryDirect account. The parent or other adult custodian can buy securities and conduct other transactions for the child, and other adults can buy savings bonds for the child as gifts.
  • Paper bonds. Adults can buy bonds in the name of a child.
Trust, estate, corporation, partnership and some other entities Electronic bonds (in TreasuryDirect): Yes
Paper bonds:

  • Trusts and estates: In some cases, Yes
  • Corporations, partnerships, other entities: No

How can I buy I Bonds?

Two options:

What determines who owns an I Bond and who can cash it?

How you register the bond at purchase determines who owns the bond and who can cash it. The registration is the name of the owner (either a person or entity), the Taxpayer Identification Number, and, if applicable, the second-named owner or beneficiary.

What do I Bonds cost?

You pay the face value of the bond. For example, you pay $50 for a $50 bond. (The bond increases in value as it earns interest.)

Electronic I bonds come in any amount to the penny for $25 or more. For example, you could buy a $50.23 bond.

Paper bonds are sold in five denominations; $50, $100, $200, $500, $1,000

How much in I Bonds can I buy for myself?

In a calendar year, you can acquire:

  • up to $10,000 in electronic I bonds in TreasuryDirect
  • up to $5,000 in paper I bonds using your federal income tax refund

Two points:

  • The limits apply separately, meaning you could acquire up to $15,000 in I bonds in a calendar year
  • Bonds you buy for yourself and bonds you receive as gifts or via transfers count toward the limit. Two exceptions:
    • If a bond is transferred to you due to the death of the original owner, the amount doesn’t count toward your limit
    • If you own a paper bond issued before 2008, you can convert it to an electronic bond in your account in TreasuryDirect regardless of the amount of the bond. (The annual limit before 2008 was greater than today’s limit of $10,000.)

Can I buy I Bonds as gifts for others?

Yes.

Electronic bonds: You can buy them as gifts for any TreasuryDirect account holder, including children.

Paper bonds: You can request bonds in the names of others and then, once the bonds are mailed to you, give the bonds as gifts.

How much in I Bonds can I buy as gifts?

The purchase amount of a gift bond counts toward the annual limit of the recipient, not the giver. So, in a calendar year, you can buy up to $10,000 in electronic bonds and up to $5,000 in paper bonds for each person you buy for.

Disadvantages

The disadvantages, although minimal are:

  • The bonds are Federally taxable
  • There is a maximum amount that you can buy
  • Minimum term of ownership is one year
  • Early redemption penalties if redeemed before 5 years, forfeit interest from the previous 3 months

So if you are looking to boost your yield on some of your cash, and getting more from a bank savings account, certificate of deposit, brokerage cash account, or treasury bond, you should seriously consider a Series I Bond.

Public Relations Handbook

by Fred Fuld III

The Public Relations Handbook by Robert L. Dilenschneider is  compilation of information and guidance for various types of pubic relations situations.

Whether it relates to politics, the government, educational institutions, a crisis issue, investor relations, working with the media, dealing with social media, or public relations issues in other countries, this book has it covered.

Each chapter is written by an expert in their area of public relations expertise, and all chapters have summary takeaways at the end.

If you are involved in PR as a small business owner  or if you are in charge of public relations for a large organization, the Public Relations Handbook is for you.


Affiliate links on this page

Top War Stocks

by Fred Fuld III

No one likes a war. But no one likes their stock portfolio to drop during a war. One possible way of offsetting any portfolio losses during wartime is through stocks involved in the defense industry.

Many investors are morally opposed to owning stocks in companies that benefit from the manufacture of weapons, and that’s understandable. If that’s you, then this article is probably not for you.

With the chance of Russia and Ukraine going to war in the near future (or if they haven’t already by the time you read this article), many of the defense and weapons companies have had their stocks move up in price.

For example, Lockheed Martin (LMT) has increased by 4% over the last month. General Dynamics (GD) has moved up from 203 a share to above 216 per share, an increase of 6.4%.

If you are looking to get exposure in this industry, the following United States based defense related stocks all have trailing price to earnings ratios of less than 25, forward price to earnings ratios of less than 25, and a price to earnings growth ratio of less than 2.

Company Symbol Market Cap P/E Ratio
AAR Corp. AIR 1.53B 19
Aerojet Rocketdyne Holdings, Inc. AJRD 3.04B 22
Ducommun Incorporated DCO 552.99M 17
General Dynamics Corporation GD 59.81B 19
Huntington Ingalls Industries, Inc. HII 7.43B 14
Northrop Grumman Corporation NOC 62.06B 9
Textron Inc. TXT 15.13B 21
VirTra, Inc. VTSI 66.70M 13

Disclosure: Author didn’t own any of the above at the time the article was written 

Debt Free Stocks Below Cash per Share & Paying Dividends

by Fred Fuld III

It may be hard to believe that with so many stocks selling at recently very high levels, that there are actually stocks that not only sell below book value but also sell below cash per share. In addition, some of these stocks have little or no debt. Plus a few of these even pay dividends.

What selling below cash means is that if the company were to go out of business today, assuming the inventory, buildings, real estate, machinery, patents, and other assets were totally worthless, there would still be enough cash to distribute to all shareholders at an amount higher than the current stock price.

Here is a list of debt free stocks, selling below cash per share, and all have been paying dividends. .

Company Symbol Mkt Cap Yield Business
DallasNews DALN 35M 9.84% Publishing
Communications Systems JCS 25M 1.94% Tech
Eneti NETI 261M 0.59% Shipping
Retail Value RVI 66M 19.08% REIT

Just remember, these stocks are selling at a low price and have very low market caps for a reason, and are extremely speculative. In addition, high dividend payouts can be a red flag, and companies can stop paying dividends at any time.

No recommendations are expressed or implied. Do your own due diligence.


Disclosure: Author didn’t own any of the above at the time the article was written.


Top Travel Stocks Short Squeeze Plays

by Fred Fuld III

Many stocks in the travel industry have suffered during the last three years due to the COVID pandemic. Some have lost over 50% of their value since 2019. As the market prices for these stocks have dropped so much, now might be the time to look for short squeeze opportunities.

Here is a quick review about the short squeeze and its terminology. When you short a stock, it means that your goal is to make money from a drop in the price of a stock. Technically, what happens is that you borrow shares of a stock, sell those shares, then buy back those shares at a hopefully lower price so that those shares can be returned. This all happens electronically, so you don’t actually see all the borrowing and returning of shares; it just shows up on your screen as a negative number of shares.

Short selling can be profitable, but sometimes when the stock moves against the short sellers, and begins to rise, the short sellers jump in right away to buy shares to cover their positions, creating what is called a short squeeze. When a short squeeze takes place, it can cause the share prices to increase fast and furiously. Any good news can trigger the short squeeze.

Some traders utilize this situation by looking for stocks to buy that may have a potential short squeeze. Here is what a short squeeze trader should take into consideration:

Short Percentage of Float ~ The float is the number of freely tradable shares and the short percentage is the number of shares held short divided by the float. Amounts over 10% to 20% are considered high and potential short squeeze plays.

Short Ratio / Days to Cover / Short Interest Ratio -This is probably the most important metric when looking for short squeeze trades, no matter what you call it. This is the number of days it would take the short sellers to cover their position based on the average daily volume of shares traded. This is a significant ratio as it shows how “stuck” the short sellers are when they want to buy in their shares without driving up the price too much. Unfortunately for the shortsellers, the longer the number of days to cover, the bigger and longer the squeeze.

Short Percentage Increase ~ This is the percentage increase in in the number of short sellers from the previous month.

Check out the following list, but be aware, that often some stocks are heavily shorted for a reason. All these stocks have significant short metrics, but they have very low market caps and floats.

Company Symbol Days to Cover % of Float Shorted
Carnival Corporation & plc CCL 2 10%
Expedia Group, Inc. EXPE 2.9 5%
Lindblad Expeditions Holdings, Inc. LIND 23.9 19%
Norwegian Cruise Line Holdings Ltd. NCLH 1.6 10%
Royal Caribbean Cruises Ltd. RCL 2.9 6%
TripAdvisor, Inc. TRIP 4 12%

So as an example, Carnival has 10% of the float shorted, and it will take two days for the short sellers to cover their positions, based on the average daily volume.

Obviously, there is no guarantee that these stocks will go up, but if I was short any stock, I wouldn’t want to waste any time covering my position if the stock started to move up sharply, before all the other short sellers clamor in and drive the price way up.

Disclosure: Author has a short and long option position in CCL.