This May Be the World’s Smartest Wallet

First, I own this wallet so I can attest to its quality. The Ekster Parliament wallet has a lot of advantages over the regular old fashioned pressure-on-your-rear-end wallet.

The wallet has a slim design, and of course it has RFID protection. It has a button that ejects your credit cards on a staggered basis for easy access. It can hold between four and ten cars.Ekster Wallet brown

There is also a strap on the card that allows you to store currency; however, you should be aware that if you carry around a lot of cash, the wallet will no longer be slim.

The wallet can be used with the Ekster Tracker Card with GPS and Bluetooth (sold separately), so that if you can’t find your wallet, you can call it with your cellphone, with a choice of ring tones. Your wallet can even call your cellphone, if you can’t find where you put it! Plus, the tracker has a solar charging feature.

A couple of other advantages of the Tracker. You can even set up out-of-range alerts. You can also use the Tracker s a clicker, if you are taking a selfie. You can locate your wallet with Google Home, too.

These wallets come in an assortment of six different colors to choose from and would make a great Father’s Day gift or birthday gift.

The wallet and tracker can be ordered directly from the company at:

Ekster.com

or if you prefer, you can order it through Amazon.

Remember, Father’s Day is June 20.


Affiliate links on this page.

Have You Ever Wondered if You Live In or Have a Business In a Low Income Area?

If you have ever wondered if you live in or have a business in a low income area, there is a tool created by the Small Business Administration that can provide you with that information.

This mapping tool was created for the Small Business Administration (SBA) Office of Disaster Assistance (ODA). It is intended to assist businesses with determining whether an address is located within a “low-income community”, which is one of the eligibility criteria for the Targeted Economic Injury Disaster Loan (EIDL) Advance program. “Low-income community” designations in this tool follow the specifications prescribed in HR 133/26 U.S.C. Section 45D(e).

If you are interested, check out the mapping tool.

You Can Buy an NFT to Name the Giant Sea Bass of the San Francisco Aquarium of the Bay

Smithsonian-affiliated Aquarium of the Bay is issuing a series of official Non-Fungible Tokens (NFTs) through ViciNFT representing live images of a giant sea bass residing in the aquarium’s 750,000-gallon saltwater tunnels.

NFT’s are unique digital assets. The NFT market value tripled in 2020, and a trend toward digital collectables has continued to power the economic momentum of NFTs in the crypto market in 2021.

The NFT auction, for those who do not yet have crypto money, began Tuesday, May 18, 2021 and ends at 5 PM Eastern Time on Friday, May 21, 2021.

Can now bid on eBay.

The auction is being undertaken in support of the aquarium’s non-profit charitable mission to promote environmental education and actions that support climate resilience and ocean conservation.

Aquarium of the Bay, located on San Francisco’s waterfront at PIER 39, is home to more than 24,000 marine animals and over 200 species representing the marine biodiversity of the San Francisco Bay. Visitors from around the world tour the aquarium’s glass tunnels to watch gill sharks, bat rays, jellies, octopuses, leopard sharks, sturgeons, and more.

The Giant Sea Bass NFT includes one-and-only “lifetime” images of the aquarium’s iconic resident. The species, native to the North Pacific, is renowned for its large size and long lifespan.

The Aquarium’s giant sea bass, an imposing and popular character, will be named by the NFT winner. The bass is more than 15 years old, weigh 250 pounds, measures 5-feet 6-inches long (the size of a motorcycle), and has a stoic personality.

A giant sea bass matures around age 11 or 12 and can live 75 years. The NFT owner will receive photos and videos, authenticated by Aquarium of the Bay, every six months over the lifespan of animal.

George Jacob, FRCGS, the first Aquarium President and CEO in the United States to initiate this unique partnership in the crypto realm, says, “We are excited to navigate into unchartered waters and are delighted to steer this forward jointly with ViciNFT.”

Aquarium of the Bay’s NFT partner, ViciNFT, is led by best-selling author/literary agent Bill Gladstone, who represented Marianne Williamson, Eckhart Tolle, musician Neil Young and Deepak Chopra. ViciNFT helps world-renowned institutions curate, design, market and nurture NFTs and digital collectibles for the common good.

Gladstone said, “We are so proud to be enabling this NFT to benefit the landmark San Francisco Aquarium of the Bay. We believe that NFTs for the common good can help museums and other institutions dedicated to education and cultural appreciation address the funding challenges they face now and in the future.”

The results of Aquarium of the Bay’s first NFT auction will be announced Friday from the ViciNFT website following the close of the auction at 5 p.m. ET on May 21. Those looking to bid should proceed to the official Aquarium of the Bay auction.

Have We Seen the Top of the Stock Market? Probably

by Fred Fuld III

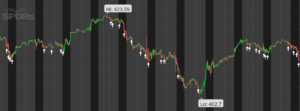
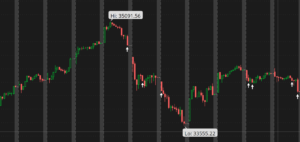
A week ago, on Monday, May 10, 2021, the SPY was trading at the 422 level. Also on the same day, the Dow Jones Industrial Average 35,091.56. Since then,   we haven’t traded even close to those levels.

SPY

The SPY has dropped about 2.7% since that time and may have further to go.

Dow Jones Industrial Average

The Dow has dropped about 2.9% since then and it looks like we could see lower levels.

There are all kinds of fundamental and technical reasons why the stock market may continue to drop, and we may never see the highs of las Monday for a long, long time. However, in this case, this is only a hunch, not a recommendation to sell or short (or even buy). It is just my opinion that we are headed into a bear market.

No recommendations are expressed or implied.

Advantages of Gold Royalty Trusts

by Fred Fuld III

Have you ever thought about investing in gold mining companies but were concerned about the risks and lack of dividend income? You may want to consider investing in gold royalty trusts as an alternative.

Gold royalty trusts provide funds to mining company which need a large amount of capital to run their mining operations. In return, the royalty trusts receive a percentage of the gold revenues. The trusts can fund many different mining companies to provide diversification and often buy gold royalty contracts from other companies.

Some trusts also use precious metals streaming, which is when a company makes an agreement with a mining company to purchase all or part of their precious metals production at a predetermined discounted price.

So some of the main benefits of gold royalty trusts are:

  • Income
  • Inflation hedge
  • Portfolio diversification of royalty contracts
  • Gold diversification from bullion, coins, and mining companies
  • Possible tax benefits for the dividends
  • Avoidance of the risks of mining companies
  • Significantly lower expenses due to small number of employees for the trust versus the large employe expenditures for the mining companies
  • Liquidity

Here are some examples of gold and silver royalty trusts that may be worth further investigation for you hard assets and/or income portfolio.

Franco-Nevada (FNV) is a Toronto, Ontario, Canada based owner of royalties and streams, and which trades on the New York Stock Exchange. The company has a market cap of $28.4 billion and pays a dividend yield of 0.78%.  Dividends are paid quarterly and have increased every year since 2014. The stock trades at 48 times trailing earnings and 44 times forward earnings. Over the last three years, revenues have grown by 15%, operating income has increased by 36%, and net income has gone up by 19%.

Wheaton Precious Metals (WPM), based in Vancouver, Canada, specializes in silver metal streaming, and has a market cap of $21 billion. Some of the companies that Wheaton has contracts with include Barrick Gold (GOLD) and Goldcorp (now part of Newmont (NEM)). Wheaton has a yield of 1.03%, with dividends paid quarterly. The latest dividend was increased by 7.7%. The stock has trailing price to earnings ratio of 37 and a forward P/E of 32.

Royal Gold (RGLD), based in Denver, Colorado and trades on the NASDAQ, provides a yield of 0.94%. Dividends were increased by 7.1% this year, and have increased every year since 2004. It is an $8.3 billion company with a trailing P/E of 31 and a forward P/E of 33.

Sandstorm Gold (SAND), based in Vancouver, has a market cap of $1.7 billion. It has a trailing P/E of 57 and a forward P/E of 56. Currently, there is no dividend.

For a list of more than half a dozen gold and silver royalty trusts along with their yields and other information, click HERE.

Hopefully, one of these gold royalty trusts will help you strike it rich.

Disclosure: Author has a long position in WPM and SAND.


Top Short Squeeze Stocks

by Fred Fuld III

Remember when GameStop (GME) went up over 700% in five days due to a short squeeze? The movie theater chain, AMC (AMC) increased by over 1,000% in ten days from a short squeeze.

Here is a review about the short squeeze and its terminology. When you short a stock, it means that your goal is to make money from a drop in the price of a stock. Technically, what happens is that you borrow shares of a stock, sell those shares, then buy back those shares at a hopefully lower price so that those shares can be returned. This all happens electronically, so you don’t actually see all the borrowing and returning of shares; it just shows up on your screen as a negative number of shares.

Short selling can be profitable, but sometimes when the stock moves against the short sellers, and begins to rise, the short sellers jump in right away to buy shares to cover their positions, creating what is called a short squeeze. When a short squeeze takes place, it can cause the share prices to increase fast and furiously. Any good news can trigger the short squeeze.

Some traders utilize this situation by looking for stocks to buy that may have a potential short squeeze. Here is what a short squeeze trader should take into consideration:

Short Percentage of Float ~ The float is the number of freely tradable shares and the short percentage is the number of shares held short divided by the float. Amounts over 10% to 20% are considered high and potential short squeeze plays.

Short Ratio / Days to Cover / Short Interest Ratio -This is probably the most important metric when looking for short squeeze trades, no matter what you call it. This is the number of days it would take the short sellers to cover their position based on the average daily volume of shares traded. This is a significant ratio as it shows how “stuck” the short sellers are when they want to buy in their shares without driving up the price too much. Unfortunately for the shortsellers, the longer the number of days to cover, the bigger and longer the squeeze.

Short Percentage Increase ~ This is the percentage increase in in the number of short sellers from the previous month.

Check out the following list, but be aware, that often some stocks are heavily shorted for a reason. All these stocks have significant short metrics.

Stock Symbol % Float Shorted Days to Cover Stock Price
PubMatic Inc. PUBM 45.53% 4.3 36.43
Esperion Therapeutics ESPR 41.16% 14 22.32
Ontrak Inc. OTRK 39.69% 3.3 31.71
Blink Charging Co. BLNK 37.78% 2 30.94

So as an example, Esperion has over 41% of the float shorted, and it will take 14 days for the short sellers to cover their positions, based on the average daily volume.

Obviously, there is no guarantee that these stocks will go up, but if I was short any stock, I wouldn’t want to waste any time covering my position if the stock started to move up sharply, before all the other short sellers clamor in and drive the price way up.

Disclosure: Author didn’t own any of the above at the time the article was written.

Stocks that May Benefit from Mother’s Day

Today, Sunday, May 9, is Mother’s Day. According to a National Retail Federation survey, American’s are expected to spend over $220 on average on their mothers this year. With spending in the tens of billions of dollars, several companies will benefit from all that cash flow.

These stocks include Hershey (HSY), Rocky Mountain Chocolate Factory Inc. (RMCF), Nestle (NSRGY), 1-800-Flowers.com Inc. (FLWS), and Amazon (AMZN).

One of the largest chocolate manufacturers in the world is the Hershey Company, headquartered in Hershey, Pennsylvania. It controls around 45% of the domestic chocolate market. Its products are offered in about 80 countries including the United States, China, Brazil, India, and Mexico.

The company has a market cap of $35 billion and pays a dividend yield of 1.91%. The stock trades at 25 times trailing earnings and at 24.6 times forward earnings.

Rocky Mountain Chocolate Factory Inc, a company that manufactures chocolate candies and confectionery products. Founded in 1981 and based in Colorado, it operates in the United States, Japan, Canada, Philippines, South Korea, and the United Arab Emirates.

Rocky Mountain Chocolate Factory Inc. has a low market cap of $36 million and has a trailing price to earnings ratio of 24.

Nestle, a famous chocolate producer founded in 1866By sales, the Swiss company is the world’s largest food and beverage company.

The company has a market cap of $336 billion and pays dividend yield of 2.53%. It trades at 25 times trailing earnings and at 26 times forward earnings.

Another company that might benefit from Mother’s Day sales is 1-800-Flowers.com Inc. Based in New York, the company was founded in 1982. 1-800-Flowers.com offers flowers, candy, stuffed animals, gift baskets, and candles.

The company has a market cap of $2 billion and does not pay a dividend. Its stock trades at 18 times trailing earnings and at 17 times forward earnings.

Of course, there is Amazon, which sells all sorts of Mother’s Day gifts. The stock has a $1.66 trillion market cap, trades at a trailing P/E ratio of 63, and a forward P/E of 55. The company does not pay a dividend.

Happy Mother’s Day!

Disclosure: Author owns AMZN.

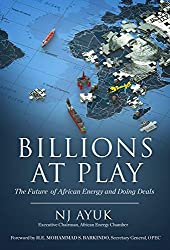
Billions at Play: The Future of African Energy and Doing Deals

by Fred Fuld III

The book, Billions at Play, provides the most comprehensive case for the development of natural resources in the African continent, which has the potential to provide substantial economic growth for countries in Africa.

Africa has remained the last location for productive development in terms of jobs, health, and economies. The author, NJ Ayuk, gives numerous reasons why the expansion of the various energy industries can help Africa move forward in growth, progress, and success.

My favorite chapter is Chapter 7 – Job Creation: Making Our Own Multiplier Effect, where the author discusses how local job creation and growth can increase geometrically from the energy industry, even with investments from non-African companies. The chapter also covers the concerns about loans, which is extremely important.

The book contains very extensive research and is completely up-to-date, including a chapter on the recovery from COVID-19. I highly recommend Billions at Play for those who want to learn about the economic potential and opportunities in Africa.


This page includes associate links

Stocks Going Ex Dividend in May 2021

The following is a short list of some of the many stocks going ex dividend during the next month.

Many traders and investors use the stock trading technique called ‘Buying Dividends,’ also commonly referred to as ‘Dividend Capture.’ This is the strategy of buying stocks before the ex dividend date and selling the stock shortly after the ex date at about the same price, yet still being entitled to the dividend.

This technique generally works in bull markets and flat or choppy markets, but you need to avoid the strategy during bear markets. In order to be entitled to the dividend, you have to buy the stock before the ex-dividend date, and you can’t sell the stock until after the ex date.

The actual dividend may not be paid for another few weeks. WallStreetNewsNetwork.com has compiled a downloadable and sortable list of the stocks going ex dividend in the near future. The list contains many dividend paying companies, lots with market caps over $500 million, and some with yields over 2%. Here are a few examples showing the stock symbol, the ex-dividend date, the periodic dividend amount.

Anheuser-Busch Inbev SA (BUD) 5/4/2021 0.447 1.61%
Wells Fargo & Company (WFC) 5/6/2021 0.10 0.89%
Walmart Inc. (WMT) 5/6/2021 0.55 1.57%
Amgen Inc. (AMGN) 5/14/2021 1.76 3.00%
Consolidated Edison Inc (ED) 5/18/2021 0.775 4.00%
Hershey Company (HSY) 5/20/2021 0.804 1.96%
Johnson & Johnson (JNJ) 5/24/2021 1.06 2.58%
Lockheed Martin Corporation (LMT) 5/28/2021 2.60 2.73%

The additional ex-dividend stocks can be found HERE . (If you have been to the page before, and the latest link doesn’t show up, you may have to empty your cache.) If you like dividend stocks, you should check out some of the other high yield stock lists at WSTNN.com HERE .

Dividend definitions:

Declaration date: the day that the company declares that there is going to be an upcoming dividend.

Ex-dividend date: the day on which if you buy the stock, you would not be entitled to that particular dividend; or the first day on which a shareholder can sell the shares and still be entitled to the dividend.

Record date: the day when you must be on the company’s books as a shareholder to receive the dividend. The ex-dividend date is normally set for stocks at two business days before the record date.

Payment date: the day on which the dividend payment is actually made, which can be as long at two months after the ex date.

Don’t forget to reconfirm the ex-dividend date with the company before implementing this technique.

Disclosure: Author did not own any of the above at the time the article was written; affiliate links.