Cruising for Cruise Stocks

by Fred Fuld III

January through March is generally the busiest time of the year for reservations on cruise lines, since it is the best time of year for vacationers to plan their spring and summer cruise vacations. And if you are a shareholder, you can get lots of complementary onboard credits.

There are just a few opportunities to climb on board with cruise stocks. Hopefully they won’t sink or experience choppiness, but will be smooth sailing for investors. Here they are:

Carnival Corp. (CCL)

Carnival is one of the largest cruise and vacation companies in the world. Their cruise lines which operate out of North America, the United Kingdom, Germany and Italy, include Carnival Cruise Lines, Holland America Line, Princess Cruises, Seabourn Cruise Line and Windstar Cruises in North America; AIDA in Germany; Costa Cruises in southern Europe; P&O Cruises, Cunard Line, Ocean Village and Swan Hellenic in the United Kingdom; and P&O Cruises in Australia. They are headquartered in Miami, Florida and London, England. The stock trades at 12.9 times trailing earnings and 11.5 times forward earnings. It pays a decent yield of 3.55%.

Carnival plc (CUK)

This is the ADR for the Carnival stock which trades on the London Exchange. An explanation is necessary. Carnival Corporation & Carnival plc operates under a dual listed company structure in which Carnival Corporation and Carnival plc operate as a single economic entity through contractual agreements between each of their own separate legal entities. Shareholders of both Carnival Corporation and Carnival plc have the same voting participation and economic interest but their shares are listed on different stock exchanges and are not fungible. [Is this as clear as dirty water?]

Carnival Corporation common stock is traded on the New York Stock Exchange under the symbol CCL. Carnival plc is traded on the London Stock Exchange under the symbol CCL and as an ADS on the New York Stock Exchange under the symbol CUK.

Carnival is the only company in the world to be included in both the S& P 500 index in the US and the FTSE 100 index in the UK. If you look at the graphs for the Corp. and the plc stocks, they match almost perfectly

Royal Caribbean Cruises Ltd. (RCL)

This company owns Royal Caribbean International and Celebrity Cruises. It also owns Pullmantur S.A., which has ships in Europe and Latin America. The company also offers land tour vacations in Alaska, Canada and Europe. It is headquartered in Miami, Florida. The stock has a trailing P/E 13.4 and a forward P/E or 11.3. It has a yield of 2.5%.

Norwegian Cruise Line (NCLH)

This company operates the Norwegian Cruise Line, Oceania Cruises, and Regent Seven Seas Cruises brands. The stock trades at 12.2 times trailing earnings and 9.5 times forward earnings.

Author did not own any of the above at the time the article was written.

Football Super Bowl Stock Market Indicator

by Fred Fuld III

Next Sunday, February 3, 2019, the Super Bowl LIII will take place  between the two-time defending American Football Conference (AFC) champion New England Patriots and the National Football Conference (NFC) champion Los Angeles Rams.

The Super Bowl Stock Market Indicator is a strategy to predict whether the stock market, as measured by the Dow Jones Industrial Average, will be up or down for the year utilizing the results of the Super Bowl for that particular year.

This methodology predicts that if a team from the National Football Conference or a team that was in the NFL before the NFL/AFL merger wins the Super Bowl, there will be a bull market for the year and the Dow will go up.

However, if a team from the American Football Conference wins, then there will be a bear market and the Dow will drop.

Leonard Koppett, an American sportswriter, first noticed this correlation  in 1978.

This indicator has been correct roughly 80% of the time. What do you think will happen this year?

Super Bowl is a registered trademark of NFL Properties LLC


Stocks Going Ex Dividend in February 2019

by Fred Fuld III

The following is a short list of some of the many stocks going ex dividend during the next month.

Many traders and investors use the stock trading technique called ‘Buying Dividends,’ also commonly referred to as ‘Dividend Capture.’ This is the strategy of buying stocks before the ex dividend date and selling the stock shortly after the ex date at about the same price, yet still being entitled to the dividend.

This technique generally works in bull markets and flat or choppy markets, but you need to avoid the strategy during bear markets. In order to be entitled to the dividend, you have to buy the stock before the ex-dividend date, and you can’t sell the stock until after the ex date.

The actual dividend may not be paid for another few weeks. WallStreetNewsNetwork.com has compiled a downloadable and sortable list of the stocks going ex dividend in the near future. The list contains many dividend paying companies, lots with market caps over $500 million, and many with yields over 2%. Here are a few examples showing the stock symbol, the ex-dividend date, the periodic dividend amount, and annual yield.

MetLife, Inc. (MET) 2/4/2019 0.42 3.69%
Boeing Company (BA) 2/7/2019 2.055 2.26%
Constellation Brands Inc (STZ) 2/11/2019 0.74 1.80%
Schlumberger N.V. (SLB) 2/12/2019 0.50 4.59%
Eli Lilly and Company (LLY) 2/14/2019 0.645 2.24%
Target Corporation (TGT) 2/19/2019 0.64 3.54%
Microsoft Corporation (MSFT) 2/20/2019 0.46 1.72%
Johnson & Johnson (JNJ) 2/25/2019 0.90 2.79%
Goldman Sachs Group, Inc. (GS) 2/27/2019 0.80 1.59%

The additional ex-dividend stocks can be found HERE . (If you have been to the page before, and the latest link doesn’t show up, you may have to empty your cache.) If you like dividend stocks, you should check out some of the other high yield stock lists HERE . Most of the lists are free.

Dividend definitions:

Declaration date: the day that the company declares that there is going to be an upcoming dividend.

Ex-dividend date: the day on which if you buy the stock, you would not be entitled to that particular dividend; or the first day on which a shareholder can sell the shares and still be entitled to the dividend.

Monthly Dividend Stock List

Record date: the day when you must be on the company’s books as a shareholder to receive the dividend. The ex-dividend date is normally set for stocks at two business days before the record date.

Payment date: the day on which the dividend payment is actually made, which can be as long at two months after the ex date.

Don’t forget to reconfirm the ex-dividend date with the company before implementing this technique.

Disclosure: Author did not own any of the above at the time the article was written.

Six Ways to Make Money in a Bear Market

by Fred Fuld III

There are many ways to make money from a bearish stock market, some speculative, and some not very risky. And this is a good thing, because smaller investors need a way to protect themselves, and even make money on the downside. This has been a strong stock market for the last ten years, and many investors think that we may be at or near the top. So here are several options to choose from.

1. Shorting Stocks

OK, let’s get this one over with first because it is one of the most speculative ways of making money in a bear market. In simple terms, you make money when the stock goes down and you lose money when the stock goes up. What technically happens is that you borrow the shares and immediately sell them (this all is done electronically through your brokerage firm) and since you owe those shares, you eventually have to buy them back at some price, hopefully a lower price. The difference between your sale price and eventual purchase price is your profit (or loss, if you buy back at a higher price).

Can you make a lot of money shorting stocks in a bear market? Yes. Is it speculative? Very. Can you lose a lot? Most definitely. This is why it is so risky. When you short a stock, the lowest point it can drop to is zero. Whereas, if the stock goes up, the amount it can rise is unlimited. Let’s say you short 100 shares of a stock at $20 a share. If you put up funds equal to 100% of the value of the shorted amount, and the stock drops to zero, you’ve made a 100% return. However, suppose the stock goes from 20 to 100, you end up losing 400% of your money with lots of margin calls along the way.

Have I shorted stocks? Yes. Have I made money from shorting? Yes, especially during the 2008 stock market crash. Have I lost a big chunk of my profits by closing out my short positions and going long, trying to predict the bottom? In the interest of full disclosure, yes. I made the second worse decision I could have made when shorting, and that is predicting the bottom of the market too soon. The worst decision would have been to hold on to my short positions after the market bottoms and starts to make a quick rise. Often when the market bottoms at the end of a bear market, the rise is very sharp and fast, and can totally wipe out short position profits very quickly and then some.

But even on a short term basis, an investor can lose money very fast. A friend of mine, who is a trader, told me that he does a lot of shorting but always hedges his shorts by buying calls to protect himself in case the stock moves up. When I told him that I never hedge my individual stock shorts, he said “You’re kidding! I never give advice to anyone, but I’m going to give you some advice. Never short a stock without hedging. You might be watching the market, then get up and go to the bathroom, come back a half hour later and discover that you’ve been wiped out!”

Even though my bathroom breaks are not that long, he does have a good point. A few months ago, shortly after I shorted a high stock price real estate investment trust (around $100 a share), the position went against me by $13 a share. That’s a $1,300 loss for every hundred shares in one day! I still had the short position after the market closed, and had the pleasure of trying to sleep at night, wondering if there was going to be a takeover the next morning or some other good news that would drive the price even higher, making my losses worse. (As a follow-up, I did make a huge profit. The stock ended up dropping from $113 to the mid-forties after a couple weeks, but that’s another story.)

So in summery, do I think you should short stocks? Absolutely not, unless you are a professional trader. The risk is unbelievable. If you understand options real well, hedged short selling might be OK, as long as you are an advanced trader, and know what you’re doing.

2. Short (Bearish) ETFs

A new financial animal appeared on the scene several years ago which has become very popular, a type of Exchange Traded Fund called the Bearish ETF or Short ETF. What these ETFs do is provide a return opposite to the return of the index, industry, or sector that it is tracking.

For example, the Short Dow30 ProShares (DOG) provides a return that is the inverse of the Dow Jones Industrial Average. If the Dow goes down 2%, the DOG goes up 2%. The Short QQQ ProShares (PSQ) ETF gives a return that is the inverse of the NASDAQ 100 Index. If you are bearish on gold, you can buy the PowerShares DB Gold Short ETN (DGZ) ETF.

The nice thing about these short ETFs is that your losses are limited. Also, if you are long individual stocks that you don’t want to sell, these can be good for protecting your portfolio on the downside.

3. Leveraged Bearish ETFs

If you like volatility, you will love the leveraged bearish ETFs. What these ETFs do is provide double, and in some cases triple the inverse return of indices.Some examples include the UltraShort Telecommunications ProShares UltraShort Consumer Services ProShares (SCC) and the ProShares UltraShort S&P S&P 500 (SDS).

In addition there are several triple leveraged bearish ETFs. Daily Real Estate Bear 3X Shares (DRV), Daily Energy Bear 3X Shares (ERY), and UltraPro Short Russell 2000 (SRTY) are just a few of the many 3X bearish ETFs.

Talk about price moves! The volatility of these things is unbelievable, and so are the wide bid and asked spreads that I’ve seen occasionally.

The advantage of these trading vehicles is that they are a way of shorting on margin, with a limit on the downside. The disadvantage is that the losses are quick and large, especially with the triple leverage short ETFs.

4. Bear Funds

It may be hard to believe, but there are actually a large number of bearish mutual funds for the long term bearish investors. These include the Grizzly Short Fund (GRZZX), the PIMCO StocksPlus TR Short Strategy Institutional Fund (PSTIX), and the ProFunds Bear Investors Fund (BRPIX). These funds have minimum investments ranging from $1,000 to $5,000,000.

5. Puts

First, a little about option pricing.  Puts and calls are priced on a per share basis, so a put at $1 would cost $100 for 100 shares, or a call at $3.50 would cost $350.

A put is the option to put your stock to someone at a particular price within a certain period of time. In other words, if you own a stock that is trading at 22 and you buy a put at a dollar which gives you the right to put your stock to someone at $20 per share within three months, there are a couple of things that could happen. The stock could tank to $14 a share and you could put your stock at 20, or just resell the put for 6 and collecting the profit. You would be far better off than just doing nothing. And if the stock goes up or stays about the same, you are just out your $100 for the option. Puts can be useful for experienced traders.

6. Cash

There is one other way to make money in a bear market. Sell everything, and keep your money in cash, with the safest way being a T-bill money market fund, that only owns T-bills. (Money market funds that invest in repos are supposed to be just as safe, but I consider them slightly more risky than T-bills.) The advantages are that you can’t lose money and you can receive an income from the investment.

The alternative cash investment is putting your money in a bank certificate of deposit or savings account. Your money is safe up to the FDIC limits.

I’ve been putting off writing this article because I kept thinking that we weren’t at the market peak yet. Maybe now that I’ve published this article, it will really be the market top.

Author does not own any of the above mentioned securities.

Houses with View for Sale in Italy for One Dollar

by Fred Fuld III

How would you like to own a house on a hill in Italy with a beautiful view? If your answer is yes, how would you like to own it for just $1.14 (one euro)?

The town of Sambuca on the Island of Sicily is looking for people to buy many of these homes, due to the fact that many of the local population have moved out. The community figures that with new buyers, revitalization will take place.

So there are plenty of homes to choose from, ranging in size from 430 square feet to 1,600 square feet. The houses are being sold directly by the city hall with no intermediaries.

Sambuca di Sicilia is located on the southwestern part of Sicily, about 42 miles west of Palermo. This 37 square mile town has a population of approximately 5,900 people.

Of course, there are a couple catches, but not a very big ones. Here they are:

  • You must send at least $17,200 renovating the home
  • A $5,700 deposit is required, which will be returned once the renovation is complete

That’s it.

More information can be found at comune.sambucadisicilia.ag.it


Factfulness: Ten Reasons Why We’re Wrong About the World – and Why Things Are Better Than You Think

by Fred Fuld III

I was having a discussion with a friend of mine who was complaining about how bad the world is today, and I kept telling him that he needs to get some perspective. I told him to compare how things are to how they were ten, twenty, fifty, and one hundred years ago. Unfortunately, I didn’t have all my facts at the time. Now I do.

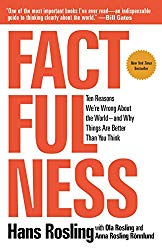
It was by chance that I came across the book, Factfulness: Ten Reasons Why We’re Wrong About the World – and Why Things Are Better Than You Think by Hans Rosling, which is extremely eye opening.

Rosling was an advisor to the World Health Organization and UNICEF, along with being a medical doctor and professor. He has stated that it is amazing how much people in general and people in power specifically, don’t know the real facts.

As a matter of fact, Rosling came up with a set of 13 fact questions, and has shown that a group of chimpanzees could answer the questions better than groups of people. Even top business and political leaders at the World Economic Forum in Davos couldn’t get two out of three questions right. This in spite of the fact that they all should have had this data at their fingertips or the top of their heads.

What questions, you might be wondering. Here is one example. How many of the worlds one year old children have been vaccinated against some disease? 20%, 50%, or 80%? If you guessed 20% or 50%, you would be wrong. The real fact is 80%.

Here’s another one. In the last 20 years, the proportion of the world population living in extreme poverty has, either almost doubled, remained the same, or almost halved. The answer is almost halved.

One more. In all low income countries across the world, how many girls finish primary school? 20%, 40% or 60%? It is 60%.

Chapter 2, The Negativity Instinct, has a whole section on how the world is getting better.

  • Extreme poverty has dropped from 50% in 1966 to 9% in 2016
  • Life expectancy worldwide has gone from around 45 years in 1950 to 72 years in 2017
  • Oil spills have dropped from 636 in 1979 to 6 in 2016
  • The percentage of children dying before their fifth birthday fell from 44% to 4% (worldwide)
  • Plane crash deaths per 10 billion passenger miles have dropped from 2100 to one
  • Ozone depletion of 1000 tons of ozone depleting substances used from 1,663 to 22
  • and so on with many more examples.

Those are just some of the bad things decreasing. He also provides facts on good things increasing, such a worldwide literacy rising from 10% to 86%, and child cancer survival rising from 58% to 80%.

My favorite chart that he provides showing, in his opinion, culture and freedom, is the number of guitars per million people, rising from 200 in 1962 to 11,000 in 2014.

I have barely touched the surface about what is covered in this book. It is filled with anecdotes, graphs, and pictures, and is easy to read and understand.

I highly recommend Factfulness. After you read it, you will be amazed what you learn and what you didn’t know.


Top Dividend Stocks Under $10 per Share

by Fred Fuld III

The advantage of owning dividend stocks is that your invested capital is being returned while you are waiting for the share price to appreciate. Dividends also can add some stability to the stock price.

Even though it really doesn’t make any difference what the price of s stock is, owning a low priced stock gives investors a psychological benefit. (“A $5 stock only has to go up by $1 and I’ve made 20%.”) Plus, lower priced stocks are accessible to more investors. After all, how many investors can afford 100 shares of Amazon?

What happens if you add the two together, a low price and dividends? There are actually around 360 stocks that fit those categories, assuming yields of at least 2%. However, if you narrow it down to the stocks with the top fundamentals, there are actually eight stocks that fit into that category.

The fundamentals that are considered include:

  • P/E ratio below 15
  • Forward P/E below 15
  • Price to Earnings Growth Ratio of less than one
  • Price Sales Ratio less than one
  • Yield over 2%

For example, the office supplies company, ACCO Brands (ACCO), sells for less than $9 per share, and trades at 7.5 times trailing earnings and 6.4 times forward earnings. It sports a favorable  0.75 price to earnings growth ratio and an excellent 0.44 price/sales ratio. The latest quarterly earnings growth was 21.2% year-over-year. The yield is 2.87% and dividends are paid quarterly.

Another example is the chemical company, Valhi (VHI), based in Dallas, Texas, which yields 3.43% and trades for less than $3 per share. The stock has an extremely low P/E ratio of 2.3, and Forward P/E of 2.8.

The following is a list of the various stocks that match the previously described fundamentals.

Company Symbol Market Cap P/E Price
ACCO Brands Corporation ACCO 866.73M 7.52 8.35
BGC Partners, Inc. BGCP 2.82B 9.46 6.11
Ford Motor Company F 35.07B 6.08 8.82
Manning & Napier, Inc. MN 33.90M 1.77 2.26
Comp. Siderurgica Nacional SID 3.34B 3.65 2.64
Telefonica, S.A. TEF 44.18B 11.83 8.79
Unique Fabricating, Inc. UFAB 52.72M 10.15 5.52
Valhi, Inc. VHI 794.11M 2.3 2.33

Please note that many of these stocks have very low market caps and should be considered very speculative.

Disclosure: Author owns Ford.