Stocks Going Ex Dividend for the Month of July 2018

Here is our latest update on the stock trading technique called ‘Buying Dividends,’ also commonly referred to as ‘Dividend Capture.’ This is the process of buying stocks before the ex dividend date and selling the stock shortly after the ex date at about the same price, yet still being entitled to the dividend.

This technique generally works only in bull markets, and can work in flat or choppy markets, but you need to avoid the technique during bear markets. In order to be entitled to the dividend, you have to buy the stock before the ex-dividend date, and you can’t sell the stock until after the ex date.

The actual dividend may not be paid for another few weeks. WallStreetNewsNetwork.com has compiled a downloadable and sortable list of the stocks going ex dividend in the near future. The list contains many dividend paying companies, lots with market caps over $500 million, and yields over 2%. Here are a few examples showing the stock symbol, the ex-dividend date, the quarterly dividend amount, and annual yield.

American Express Company (AXP) 7/5/2018 0.35 1.39%
Barnes & Noble, Inc. (BKS) 7/5/2018 0.15 9.68%
Bristol-Myers Squibb Company (BMY) 7/5/2018 0.40 2.89%
Cisco Systems, Inc. (CSCO) 7/5/2018 0.33 2.84%
Ethan Allen Interiors Inc. (ETH) 7/9/2018 0.19 3.15%
Intuit Inc. (INTU) 7/9/2018 0.39 0.75%
Hormel Foods Corporation (HRL) 7/13/2018 0.19 1.95%
Colgate-Palmolive Company (CL) 7/17/2018 0.42 2.49%
Caterpillar, Inc. (CAT) 7/19/2018 0.86 2.28%
Foot Locker, Inc. (FL) 7/19/2018 0.35 2.40%
Lowe’s Companies, Inc. (LOW) 7/24/2018 0.48 1.69%
Clorox Company (CLX) 7/31/2018 0.96 2.63%
Hasbro, Inc. (HAS) 7/31/2018 0.63 2.57%

The additional ex-dividend stocks can be found here at wstnn.com. (If you have been to the website before, and the latest link doesn’t show up, you may have to empty your cache.) If you like dividend stocks, you should check out some of the other high yield stock lists at HERE or WStNN.com. Most of the lists are free.

Dividend definitions: Declaration date: the day that the company declares that there is going to be an upcoming dividend.

Ex-dividend date: the day on which if you buy the stock, you would not be entitled to that particular dividend; or the first day on which a shareholder can sell the shares and still be entitled to the dividend.

Monthly Dividend Stock List

Record date: the day when you must be on the company’s books as a shareholder to receive the dividend. The ex-dividend date is normally set for stocks at two business days before the record date.

Payment date: the day on which the dividend payment is actually made, which can be as long at two months after the ex date.

Don’t forget to reconfirm the ex-dividend date with the company before implementing this technique.

Disclosure: Author did not own any of the above at the time the article was written.


Cruise Line Shareholders Get Free Onboard Credit

by Fred Fuld III

It’s summer. Time for vacations. Many travelers are going on cruises. Fortunately, there’s a way to get a nice bonus on the cruise, free onboard credit up to $250. The only catch is that you need to be a shareholder of the cruise line, and own at least 100 shares.

For example, Carnival (CCL), which owns Carnival Cruise Lines and Holland America, is one of the companies offering free credit to shareholders of 100 shares or more. Here is what they offer:

  • Onboard credit per stateroom on sailings of 14 days or longer US $250
  • Onboard credit per stateroom on sailings of 7 to 13 days US $100
  • Onboard credit per stateroom on sailings of 6 days or less US $ 50

Carnival, which trades on the New York Stock Exchange,  has a price to earnings ratio of 17.5 and a forward P/E of 14.4, with a price to sales ratio of 2.56. It pays a decent yield of 2.83%.

Norwegian Cruise Line Holdings (NCLH), which trades on NASDAQ, offers shareholders the following:

  • $250 Onboard Credit per Stateroom on Sailings of 15 Days or More.
  • $100 Onboard Credit per Stateroom on Sailings of 7 to 14 Days.
  • $50 Onboard Credit per Stateroom on Sailings of 6 Days or Less.

Norwegian trades at 14.9 times trailing earnings and 11.0 times forward earnings. The price sales ratio is 2.15, and the company does not pay a dividend.

Finally, Royal Caribbean Cruises (RCL), operator of the Royal Caribbean International, Celebrity Cruises, and Azamara Club Cruises, is the second largest cruise line operator after Carnival. It offers onboard credits of:

  • $250 Onboard Credit per Stateroom on Sailings of 14 or more nights.
  • $200 Onboard Credit per Stateroom on Sailings of 10 to 13 nights.
  • $100 Onboard Credit per Stateroom on Sailings of 6 to 9 nights.
  • $50 Onboard Credit per Stateroom on Sailings of 5 nights or less.

RCL has a PE of 14.6, a forward PE of 12.5, and a PS ratio of 2.73. The yield is a favorable 2.15%.

Just keep in mind that just because a cruise line company offers onboard credits, does not mean that the stock is a good investment. Nor should you buy shares in the stock just to get the free credit. However, maybe your ship will come in with one of these stocks.

Disclosure: Author didn’t own any  of the above at the time the article was written.

A Positive Outlook on Beer and Beer Stocks

by Nkem Iregbulem

Beer, one of the oldest beverages ever made by man, is a popular alcoholic beverage enjoyed by many around the world. The chemical analysis of old clay tablets revealed that the production of beer dates back to at least 3500 BC in modern day Iran. Beer was discovered — some believe unintentionally — when grains from bread were left unattended and started to ferment.

Beer grew popular in different areas for different reasons. In some places, beer became popular because it was often cleaner than the water that they had available to them in nearby rivers and canals. In other locations, beer became popular because of its taste and its effects on the drinker. Over time, the ingredients used to make the drink changed. Initially, Egyptians used barley for their beer, but eventually in the Middle Ages, Christian monks and other artisans started to replace barley with hops. Beer has now evolved such that we wouldn’t classify the early Europeans’ version of the drink as the beer we know today.

Are you tired of beer’s bad reputation when it comes to nutrition? Do you enjoy winding down with a beer or two every now and then? You’ll be both surprised and glad to hear that beer, consumed in moderation, might actually be beneficial to your health in a couple of ways.

A study, led by Shue Huang from Penn State and conducted in China, found that the moderate consumption of beer was associated with a slower decline in HDL levels. HDL, or high-density lipoprotein, is thought to be the good kind of cholesterol. The study defined moderate consumption as a 0.5 to 1 twelve-ounce serving of beer for women and 1 to 2 twelve-ounce servings of beer for men. The study tracked close to 80,000 subjects over a six-year period to obtain its results. Even though HDL levels generally decreased over time for all participants, they found that this decline was slowest among moderate drinkers. Since HDL levels act as an indicator for the risk of cardiovascular disease, the results suggested to researchers that drinking beer in moderation may lower one’s risk of cardiovascular diseases.

Two other studies have suggested that beer may even improve bone health. The first study, published in the Journal of the American Medical Association, found that those who drank beer in moderation were 38% less likely to have osteoporosis — a very common bone disease — than those who did not consume beer. The second study, published in Osteoporosis International, saw similarly protective effects. Its results indicated that people who consumed beer in moderation faced a 20% lower risk of hip fractures than non-drinkers. Since dietary silicon is both found in beer and tied to bone growth and development, researchers suspected that this ingredient may play a role in beer’s potential bone health benefits.

Other studies have found that beer may also help prevent diabetes, cancer, and obesity and even boost creativity.

If you’re looking for more than just health benefits from beer, you could invest your money in companies involved in the beer industry. Your options for beer-related companies include: Anheuser-Busch InBev (BUD), Craft Brew Alliance, Inc. (BREW), Heineken NV (HEINY), Molson Coors Brewing (TAP), and Granite City Food & Brewery (GCFB). Some of these names may be more familiar to you than others. The BUD and TAP stocks are both traded on the New York Stock Exchange, and the BREW stock is traded on the NASDAQ exchange. Meanwhile, the HEINY and GCFB stocks are both traded over-the-counter.

Anheuser-Busch InBev is a brewing company involved in the production, distribution, and sale of beer, alcoholic beverages, and soft drinks. The company is headquartered in Belgium and was founded in 1366. Popular brands under the company include Budweiser, Corona, and Becks. As of late, the company has around 500 beer brands under its name. It splits these brands into three main categories: International Brands, Global Brands, and Local Champions. Its brand portfolio also includes some popular soft-drink brands. As the world’s largest brewery, the company boasts a very large market cap of $156.81 billion and pays a generous dividend yield of 4.43%. Given its price-to-sales ratio of 3.41, the stock is considered somewhat overpriced. It trades at 25.94 times trailing earnings and at 19.19 times forward earnings. The stock also has a price-to-book ratio of 2.17. The company faces a negative 3-year revenue growth rate of -2.92%, and its revenue has been decreasing each fiscal year since 2016.

Founded in 1981, Craft Brew Alliance, Inc. is a beer brewing company based in Portland, Oregon and involved in the brewing and selling of craft beers and ciders in the United States and in various other countries. Its brand portfolio includes brands such as Kona Brewing Company, Widmer Brothers Brewing, and Redhook Ale Brewery. Craft Brew Alliance has two operating segments: Beer Related operations and Brewpubs operations. However, most of the company’s revenue comes from brewing and its sales of craft beers and ciders domestically and internationally as part of the company’s Beer Relation operations segment. It sells its products through liquor stores, restaurants, bars, supermarkets, and convenience stores. The company has a market cap of $382.82 million but does not pay a dividend yield. Its stock has a normal price-to-sales ratio of 1.83 and a price-to-book ratio of 2.92. It trades at 33.56 times trailing earnings and at 33.67 times forward earnings. The company’s revenue has been increasing each fiscal year since 2016, contributing to its 3-year revenue growth rate of 1.22%.

Many people have heard of Heineken NV, a company based in Netherlands and founded in 1864. It brews and sells beer and cider around the world. Heineken is the largest cider producer in the world, and after only Anheuser-Busch InBev, it is the second largest brewer in the world. Its operating segments include Americas, Middle East & Eastern Europe, Africa, Asia Pacific, and Europe. Well-known brands under the company include Heineken, Amstel, Desperados, and Sol. Within its brand portfolio, you can find Belgian, craft, and even non-alcoholic beer. Its products can be found at retailers, bars, and restaurants. As Western Europe’s largest beer producer, the company boasts a very large market cap of $58.34 billion and pays a dividend yield of 1.56%. With a price-to-sales ratio of 2.30, the stock is slightly overpriced. It trades at 25.89 times trailing earnings and at 21.23 times forward earnings. It also has a price-to-book ratio of 3.77. Heineken NV enjoys a 3-year revenue growth rate of 4.36% as its revenue has been increasing each fiscal year since 2008.

Molson Coors Brewing is a multinational company that manufactures and sells beers globally. The company is based in Colorado and was founded in 1786. You may have heard of a few of the brands in its portfolio: Coors Light, Miller Lite, Molson Canadian, and Carling. Most of Molson Coors Brewing’s sales and operating profits come from the company’s business in the United States, followed by Canada and then Europe. As the second largest brewer by volume in the United States, the company has a market cap of $14.3 billion and pays a dividend yield of 2.48% — up from last year. The company has a price-to-sales ratio of 1.3 and a low price-to-book ratio of 1.06. It trades at 11.96 times trailing earnings and at 13.23 times forward earnings. Molson Coors Brewing enjoys a great 3-year revenue growth rate of 38.45% and its revenue has been increasing each fiscal year since 2015.

Based in Minnesota and founded in 1997, Granite City Food & Brewery is an upscale casual restaurant chain in the United States that produces its signature brews on-site at its restaurants. It operates two dining concepts called Granite City Food & Brewery and Cadillac Ranch All American Bar & Grill. At the former, you will find various menu items as well as handcrafted beer. At the latter, you will find authentic cuisines ranging from pasta to tasty meatloaf. Granite City Food & Brewery has a tiny market cap of $4.31 million, so its stock is very speculative. It also has an excellent, low price-to-sales ratio of 0.03. The company has a 3-year revenue growth rate of 3.86% and an even better 5-year revenue growth rate of 10.02%. Its revenue increased each fiscal year between 2009 and 2015, before dipping slightly in 2016.

Hopefully your beer stocks will perform well and you can celebrate with a couple of beers.

Disclosure: Author didn’t own any of the above at the time the article was written.


Top Short Squeeze Stocks

by Fred Fuld III

During the last month, the stock price of Tesla (TSLA) has increased by 23.9%. This is in spite of the fact that the company hasn’t generated any earnings. Many believe that the reason for the price rise in the stock is due to a short squeeze, as over 39 million shares have been shorted, amounting to 31% of the stock float. When the stock rises for any reason, short sellers scramble to cover their positions by buying the stock, and thereby driving up the price of the stock even more.

So how can you make money on the long side from short squeezes? One technique that stock traders utilize is buying short squeeze stocks, companies have been heavily shorted. Here is a more extensive explanation of what a short squeeze is.

When you short a stock, it means that your goal is to make money from a drop in the price of a stock. Technically what happens is that you borrow shares of a stock, sell those shares, then buy back those shares at a hopefully lower price so that those shares can be returned. This all happens electronically, so you don’t actually see all the borrowing and returning of shares; it just shows up on your screen as a negative number of shares.

Short sellers can be profitable, but sometimes when the stock moves against them, and begins to rise, the short sellers jump in right away to buy shares to cover their positions, creating what is called a short squeeze. When a short squeeze takes place, it can cause the share prices to increase fast and furiously. Any good news can trigger the short squeeze.

Some traders utilize this situation by looking for stocks to buy that may have a potential short squeeze. Here is what a short squeeze trader should take into consideration:

Short Percentage of Float ~ The float is the number of freely tradable shares and the short percentage is the number of shares held short divided by the float. Amounts over 10% to 20% are considered high, and potential short squeeze plays.

Short Ratio / Days to Cover / Short Interest Ratio -This is probably the most important metric when looking for short squeeze trades, no matter what you call it. This is the number of days it would take the short sellers to cover their position based on the average daily volume of shares traded. This is a significant ratio as it shows how “stuck” the short sellers are when they want to buy in their shares without driving up the price too much. Unfortunately for the shortsellers, the longer the number of days to cover, the bigger and longer the squeeze.

Short Percentage Increase ~ This is the percentage increase in in the number of short sellers from the previous month.

Here is one example. Big Lots (BIG) is a stock that is heavily shorted. As a matter fo fact, 30.6% of the float is shorted. In addition, the number of shares shorted has increased by 6% over the last reported two week period. Finally, the short interest ratio is 9. That means it would take the short sellers nine days to cover their positions, based on the number of shares that trade each day on average.

So what stocks are heavily shorted that may be worth a closer examination? Check out the following list, but be aware, that often some stocks are heavily shorted for a reason.

Company Symbol % change % of Float Days to cover
Big Lots BIG 6 30.6 9.0
Ichor ICHR 0 33.2 6.7
Mallinckrodt MNK 0 39.4 13.6
Renewable Energy REGI 12 27.4 7.4
Abercrombie & Fitch ANF 2 22.0 5.8

Maybe this is a way to squeeze some juice out of your portfolio.


Disclosure: Author owns TSLA.

The Geometry of Wealth

Book Review: The Geometry of Wealth

by Fred Fuld III

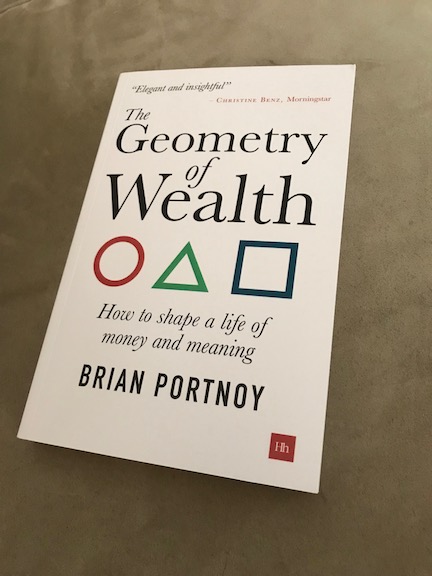
Wealth is not just about money. The book, The Geometry of Wealth, by  Brian Portnoy, PhD, CFA, explains what wealth really is and how it can be achieved.

The book is easy to understand, especially for novice investors, and explains concepts in a way that all investors can comprehend. For example, in Chapter 1, he talks about the three major challenges facing everybody with regards to money: we have more financial control, we are wired for bad decisions, and less room for ever.

Probably the most interesting chapter is “Yes, Not Really, It Depends,” which is all about what happiness really is.

If you are looking for a different spin on money, finance, and wealth, I recommend  The Geometry of Wealth. 


The Triple Crown Horse Races and Some Racing-Related Stocks

by Nkem Iregbulem

Horseracing fans have now seen or heard about Thoroughbred horse Justify’s most recent win at the Belmont Stakes race this past Saturday, June 9th. Just a couple weeks before, Justify won the Kentucky Derby on May 5th and the Preakness Stakes race on May 19th. With this third exciting win, Justify was crowned the 2018 Triple Crown winner – only the second Triple Crown winner in the last 40 years.

Even with Justify’s strong performance, Secretariat, the Triple Crown winner in 1973, still holds the time records in all three Triple Crown races. These three races are the Kentucky Derby, Preakness Stakes, and Belmont Stakes. They all occur annually, and the Triple Crown is awarded to the 3-year-old Thoroughbred horse that wins all three races in a given year. It is widely considered the highest honor that a racehorse can receive.

Before the Triple Crown became an official award, the term “triple crown” was first used by TheNew York Timesin 1923 and was then regularly used by the paper’s racing columnist at the time by 1930. However, by 1937, other writers and publications adopted the term, and the term became more established.

The Belmont Stakes is the oldest and longest of the three, and the Kentucky Derby is the youngest. Started in 1867, the Belmont Stakes race is 1.5 miles long and occurs at Belmont Park in Elmont, New York on the first or second Saturday in June. The winner of this race is covered with a blanket made of hundreds of carnations and receives the August Belmont Trophy. Started in 1873, the Preakness Stakes race is 1.1875 miles long and occurs at the Pimlico Race Course in Baltimore, Maryland on the third Saturday of May.The winner of this race is covered with a blanket of black-eyed Susan flowers, so the race is otherwise known as “The Run for Black-Eyed Susans.” The winning horse also receives the Woodlawn Vase.

Begun in 1875, the Kentucky Derby race is 1.25 miles long and occurs at the Churchill Downs racetrack in Louisville, Kentucky on the first Saturday of May. The winner of this race receives the Kentucky Derby Trophy and a blanket of roses, giving the race the nickname “The Run For the Roses.” There have been 13 Triple Crown winners crowned since the creation of the award in 1950 with the first winner being Sir Barton.

If you’re looking to get financially involved in the horse racing industry, you can choose from a variety of racing-related companies to invest in: Churchill Downs Inc. (CHDN), Dover Downs Gaming and Entertainment (DDE), and Penn National Gambling Inc. (PENN). The CHDN and PENN stocks are both listed on the NASDAQ exchange, but the DDE stock is traded on the New York Stock Exchange.

Founded in 1928 and therefore the oldest of the three companies, Churchill Downs is a racing, gaming, and online entertainment company based in Louisville, Kentucky. It hosts the Kentucky Derby at its Churchill Downs racetrack. Its other racetracks include the Arlington International Race Course in Arlington Heights, the Fair Grounds Race Course in New Orleans, and the Calder Race Course in Miami Gardens. The company also operates some casinos and hotels around the country. Most of the company’s revenue comes from within the United States.

Churchill Downs has a market cap of $4.07 billion and pays a small dividend yield of 0.51%. With a price-to-sales ratio of 5.21, its stock is considered pretty overpriced. It trades at 28.06 times trailing earnings and at 26.67 times forward earnings. The stock also has a price-to-book ratio of 12.03. Its revenue has been increasing each fiscal year since 2015 as the company enjoys a 3-year revenue growth rate of 2.81%.

Dover Downs Gaming & Entertainment Inc. is a gaming and entertainment company based in Delaware and founded in 1969. It operates its own casino, hotel, and racetrack called Dover Downs Casino, Dover Downs Hotel and Conference Center, and Dover Downs Raceway respectively. Its hotel offers conference, banquet, concert hall, and salon facilities. Its racetrack features live and simulcast horse races. However, most of the company’s revenue comes from its gaming operations.Its casino offers table games, slot machine games, poker, bars, and restaurants.

The company has a small market cap of $56.58 million, so its stock is speculative. It has a very favorable price-to-sales ratio of 0.34 and trades at 8.55 times forward earnings. It has a low price-to-book ratio of 0.53. With a negative 5-year revenue growth rate of -4.77%, the company has faced decreasing revenue values each fiscal year since 2011.

Penn National Gaming is a gaming and racing company based in Pennsylvania and founded in 1972. It stands as the second largest operator of regional casinos in the United States. In addition, it was one of the very first companies to adopt a business model, called “racino,” that combined casino operations and racetrack operations. The company has many properties scattered across the United States and Canada with three operating segments known as the Southwest, Northeast, and South/West segments.

The company has a market cap of $2.97 billion. The company’s stock has an excellent price-to-sales ratio of 0.96 and a price-to-book ratio of 9.29. It trades at 5.10 times trailing earnings and at 19.16 times forward earnings. Revenue has been increasing each fiscal year since 2014, contributing to its great 5-year revenue growth rate of 15.15%

So, if you are interested in investing in the horse racing industry, you might consider investing in the racing-related companies that you find attractive. Hopefully they turn out to be winners.


Disclosure: Author didn’t own any of the above at the time the article was written.

Chocolate May Improve Your Health and Boost Your Portfolio

by Nkem Iregbulem

Chocolate is one of the most popular foods in the world. Some of the most common types of chocolate we see are milk chocolate, dark chocolate, and white chocolate. Think you know everything there is to know about chocolate? Turns out that numerous studies have found that chocolate consumption may improve your health in a variety of ways. Chocolate may be more than just a sweet treat enjoyed around the world.

Last June, The Harvard Gazette reported on a recent study conducted by researchers in Denmark and at the Harvard T.H. Chan School of Public Health. The study was published in the journal Heart, and its participants were 55,502 men and women from the Danish Diet, Cancer, and Health Study. Researchers found an association between moderate chocolate consumption and a lower risk of atrial fibrillation, a type of irregular heartbeat. They also found that those who ate 2 to 6 one-ounce servings of chocolate per week had the lowest rate of atrial fibrillation. The chocolate consumed by participants contained relatively low levels of potentially protective ingredients, suggesting that even small doses of cocoa can go a long way in terms of possible health benefits.

A few months ago, another study found that the consumption of dark chocolate may reduce stress levels and inflammation and even boost memory, immunity, and mood. The researchers at Loma Linda University Adventist Health Sciences Centre who led this study suspect that cacao, an ingredient commonly found in dark chocolate, may be largely responsible for the candy’s potential to support cognitive, endocrine, and cardiovascular health. They suggest cacao’s protective power likely comes from the fact that that it is a great source of flavonoids, which are very potent antioxidants and anti-inflammatory agents.

Chocolate may boost not only your health but also your portfolio. You can choose from a variety of chocolate-related companies including Rocky Mountain Chocolate Factory Inc. (RMCF), The Hershey Co. (HSY), Mondelez International (MDLZ), Tootsie Roll Industries Inc. (TR), Nestle (NSRGY), and Lindt & Sprungli AG (LDSVF). The RMCF and MDLZ stocks are traded on the NASDAQ exchange, and the HSY and TR stocks are traded on the New York Stock Exchange. The NSRGY and LDSVF stocks are both traded over-the-counter.

Your first option is Rocky Mountain Chocolate Factory Inc, a company that manufactures chocolate candies and confectionery products. It operates in the United States, Japan, Canada, Philippines, South Korea, and the United Arab Emirates. The company’s business activity can be divided into a couple segments: Franchising, Manufacturing, Retail Stores, U-Swirl Operations, and Other segments. Its products include clusters, truffles, caramels, mints, and molded chocolates. Rocky Mountain Chocolate Factory Inc. has a small market cap of $64.7 million and pays a dividend yield of 4.26%. With a negative 3-year growth rate of -2.84%, the company has seen decreasing revenue values each fiscal year since 2015. Its stock has a price-to-sales ratio of 1.71 and a price-to-book ratio of 3.29. The stock also trades at 21.82 times trailing earnings.

A second option is The Hershey Co., one of the largest chocolate manufacturers in the world. The Hershey Company, headquartered in Hershey, Pennsylvania, controls around 45% of the domestic chocolate market. Its products are offered in about 80 countries including the United States, China, Brazil, India, and Mexico. The leading chocolate company sells chocolate, sweets, mints, and other snacks to its customers. The company has a market cap of $18.94 billion and pays a dividend yield of 2.92%, which has been decreasing since 2015. With a price-to-sales ratio of 2.56, its stock is slightly overpriced. The stock trades at 18.27 times trailing earnings and 16.89 times forward earnings. The company’s stock also has a high price-to-book ratio of 19.66. The Hershey’s revenues have been increasing each fiscal year since 2015, giving it a 3-year revenue growth rate of 0.42%

You may also want to consider Mondelez International, a confectionary, food, and beverage company based in Illinois. It manufactures chocolate, biscuits, gum, candy, beverages, cheese, and groceries. However, chocolate alone is responsible for about 30% of the company’s sales revenue. Its portfolio includes billion-dollar companies such as Chips Ahoy! and Oreo.The company has a nice market cap of $57.91 billion and pays a dividend yield of 2.17%. The company’s stock is slightly overpriced with a price-to-sales ratio of 2.30. It trades at 17.25 times trailing earnings and 16.03 times forward earnings. Its price-to-book ratio is 2.22. Mondelez International’s revenue has been decreasing each fiscal year since 2013 as the company faces a negative 3-year growth rate of -8.89%.

Another option is Tootsie Roll Industries Inc., a company that manufactures and sells candy to wholesale distributors and to retail stores. It candy products — many of which are chocolate-based — include Tootsie Rolls, Tootsie Pops, Junior Mints, Charms, Blow-Pops, and Dots. The company mainly operates in the United States, Canada, and Mexico, but over 90% of its sales comes from customers in the United States. The company has a market cap of $1.45 billion and pays a dividend yield of 1.21%. Its stock has a price-to-sales ratio of 3.72, making it somewhat overpriced. The stock trades at 24.25 times trailing earnings and has a price-to-book ratio of 1.60. Tootsie Roll’s revenue has been decreasing each fiscal year since 2014 as the company faces a negative 5-year growth rate of -1.14%.

Nestle is another well-known, chocolate-related powerhouse to consider. By sales, the Swiss company is the world’s largest food and beverage company. Brands such as Nestle, Nescafe, Perrier, Pure Life, and Purina are all part of the company’s product portfolio. Under these brands and various other brands, the company offers baby food, cereal, bottled water, coffee products, chocolate, frozen food, and confectionery products. The company has a large market cap of $231.56 billion and pays dividend yield of 3.18%, but this value has been decreasing each year since 2015. With a price-to-sales ratio of 2.59, the company’s stock is slightly overpriced. It trades at 31.28 times trailing earnings and 19.49 times forward earnings. The stock has a price-to-book ratio of 3.74. Nestle’s revenue has been increasing each fiscal year since 2015, giving it a 5-year growth rate of 0.04%.

You might also look at Lindt & Sprungli AG, a Swiss chocolatier and confectionery company that manufactures and sells premium chocolate products. It is best known for its chocolate truffles and chocolate bars. The company focuses its operation in developed markets in Europe and North America. Lindt & Sprungli AGoffers its products under brand names such as Lindt, Ghirardelli, Russell Stover, Whitman’s, Pangbourne, Caffarel, and Lindor. The company has a nice market cap of $7.55 billion and pays a dividend yield of 0.93%, which has been increasing each year since 2014. Its stock has a price-to-book ratio of 1.78 and an excellent price-to-sales ratio of 0.37. It trades at 3.30 times trailing earnings and 30.30 times forward earnings. Revenue has been increasing each fiscal year since 2011 as the company enjoys a 3-year revenue growth rate of 6.49%.

Turns out that chocolate may be beneficial in more ways than one. Beyond merely satisfying your sweet tooth, chocolate can better your health and sweeten your portfolio.

Disclosure: Author didn’t own any of these stocks at the time the article was written.


Less Than a Year Ago, I Said Twitter was a Screaming Buy – Was I Right?

by Fred Fuld III

It was only about ten months ago, on August 2, 2017, that I wrote the article, Why Twitter is a Screaming Buy. I discussed several reasons, including Twitter’s biggest asset (Donald Trump). Also, an extensive coverage of earnings and the lack thereof. I also came up with some suggestions about how Twitter could improve its revenues.

At the time that I wrote the article, the stock was trading for less than $16 a share. It closed at the end of the day at 16.07.  What’s it trading for now? Currently, the stock is up 3% so far today, trading at 40.94.

What’s the return if you had bought the stock back on August 2? A very respectable 155%! Not bad for a holding period of less than a year.

The bird is flying!!!


Disclosure: Author owns TWTR.

What Elon Musk Said at the Tesla Annual Shareholders Meeting Yesterday

by Fred Fuld III

The Tesla (TSLA) annual meeting was packed with shareholders yesterday. at the Computer History Museum on North Shoreline Blvd. in Santa Clara, California. I arrived an hour and a quarter early and the long line to get in through security was already lined up all across the very wide building.

Tesla SemiOutside the entrance were the latest Tesla vehicles, including the Tesla Semi truck. But the one that attracted the most interest was the new Tesla Roadster.

By the time the meeting started, it was standing room only. The official part of the meeting went quickly, and the corporate voting results were in line with what the directors recommended.

Once that was done, Elon Musk came out and gave a presentation, which included a question and answer session at the end.

Musk began by saying that of all American car companies, only two haven’t gone bankrupt, Ford and Tesla. He initially pointed out that he expects Tesla to be producing 5,000 cars a week by the end of this month.

Tesla Steering WheelHe discussed the market share of the Model 3 and said that it is the best selling midsize of any kind, not just electric or hybrids. He also expects to be producing lower cost cards by the end of the year.

He mentioned that employee safety is an important issue for him and that the company’s injury rates are 6% below the industry average year to date. It has a 50% decrease in the injury rate from the  final years of NUMMI (the Toyota GM partnership). Most of the injuries are due to repetitive stress, such as back strain, and the company is working on that issue by rotating employees through different roles.

Tesla currently has 9,969 superchargers worldwide. The company has 1 gigawatt of cumulative energy storage deployment year-to-date, and expects another gigawatt in less than a year, with each year being the combined sum of future years.

Tesla ships more battery capacity than all the other EVs combined.

SolarCity is now installing its first solar roofs, where the entire roof is made up of roofing materials that are solar panels. They are still under evaluation because the company wants to be sure that they will last 30 years.

The company is expecting positive GAAP net income and positive cash flow in the third and fourth quarter. In addition, Musk has no plans for incremental debt or equity funding.

The Model Y production will begin next year.

The Tesla Semi is being developed. The company is working on obtaining acceptance in countries around the world.

Tesla RoadsterThe Tesla Roadster can outperform any gas car in every way. Musk said that they are even offering a “SpaceX Option Package”.

The gigafactory is one third completed and will be completed in four to five years. At that time, it will be the biggest building in the world. Everyone will be produced in it: the vehicle, battery pack, and powertrain.

Tesla is also working on setting up its first gigafactory outside the US, which will be built in China. The next one will be built in Europe, with an ultimate goal of 10 to 12 worldwide.

Everything is recycled and the company is spending more on R&D to improve recycling, especially in the gigafactories.

In regards to insurance, Tesla is getting the cost of insurance lower than the BMW 3 Series.

The waiting time for the Model 3 in the US is three to four months, however, the right side driver models have a waiting period over a year. Test driving the Model 3 should be available by the end of the month.

Musk expects to have ten Tesla body shop repair locations by the end of the month, with same day repair service for many of them, which will have restocked parts.

Tesla expects to have a compact car in less than five years.

Tesla is enhancing the Tesla app. It can already change the temperature of your car before you get in it, but Musk wants the app to anticipate your needs as if it was a chauffeur.

Musk has no plans to make motorcycles, due to an accident he was in when he was young.

One amusing incident was a question that was asked by a member of an animal rights group. She asked if leather could be removed from the gear stick shift and the steering wheel. So Musk said, “Stick shift? What’s that?”

Disclosure: Author is a shareholder of TSLA.

Tesla Roadster


Stocks Going Ex Dividend During the Month of June 2018

Here is our latest update on the stock trading technique called ‘Buying Dividends,’ also commonly referred to as ‘Dividend Capture.’ This is the process of buying stocks before the ex dividend date and selling the stock shortly after the ex date at about the same price, yet still being entitled to the dividend.

This technique generally works only in bull markets, and can work in flat or choppy markets, but you need to avoid the technique during bear markets. In order to be entitled to the dividend, you have to buy the stock before the ex-dividend date, and you can’t sell the stock until after the ex date.

The actual dividend may not be paid for another few weeks. WallStreetNewsNetwork.com has compiled a downloadable and sortable list of the stocks going ex dividend in the near future. The list contains many dividend paying companies, lots with market caps over $500 million, and yields over 2%. Here are a few examples showing the stock symbol, the ex-dividend date, the quarterly dividend amount, and annual yield.

Southwest Airlines Company (LUV) 6/5/2018 0.16 0.93%
Abercrombie & Fitch Company (ANF) 6/7/2018 0.20 3.67%
Ross Stores, Inc. (ROST) 6/11/2018 0.225 0.87%
HP Inc. (HPQ) 6/12/2018 0.139 2.40%
Best Buy Co., Inc. (BBY) 6/13/2018 0.45 2.14%
Coca-Cola Company (KO) 6/14/2018 0.39 3.48%
Merck & Company, Inc. (MRK) 6/14/2018 0.48 3.14%
Las Vegas Sands Corp. (LVS) 6/19/2018 0.75 3.65%
Tiffany & Co. (TIF) 6/19/2018 0.55 1.51%
Yamana Gold Inc. (AUY) 6/28/2018 0.005 0.70%
Xerox Corporation (XRX) 6/28/2018 0.25 2.97%
Wolverine World Wide, Inc. (WWW) 6/29/2018 0.08 0.76%

The additional ex-dividend stocks can be found here at wstnn.com. (If you have been to the website before, and the latest link doesn’t show up, you may have to empty your cache.) If you like dividend stocks, you should check out some of the other high yield stock lists at HERE or WStNN.com. Most of the lists are free.

Dividend definitions: Declaration date: the day that the company declares that there is going to be an upcoming dividend.

Ex-dividend date: the day on which if you buy the stock, you would not be entitled to that particular dividend; or the first day on which a shareholder can sell the shares and still be entitled to the dividend.

Monthly Dividend Stock List

Record date: the day when you must be on the company’s books as a shareholder to receive the dividend. The ex-dividend date is normally set for stocks at two business days before the record date.

Payment date: the day on which the dividend payment is actually made, which can be as long at two months after the ex date.

Don’t forget to reconfirm the ex-dividend date with the company before implementing this technique.

Disclosure: Author did not own any of the above at the time the article was written.